Plot
? |
Symb
? |
Source
* |
Average ? |
Thresholds ? |
N_
data |
QC1
parameter |
Data
downloads |
Remarks |
| method |
value |
unit |
method |
value |
| 1 |
• | QC1DB |
MEDIAN |
0.594 |
ADU/hr/px |
VAL | 0,2 |
14 |
current_dark |
this |
last_yr |
all
|
DARK current, in ADU per hour per pixel (whole chip) |
| |
|
*Data sources: QC1DB: QC1 database; LOCAL: local data source
|
Plot 1
scores:  1| 1|
| | data source: | giraffe_dark
(QC1 database) |
| dataset: | current_dark | • |
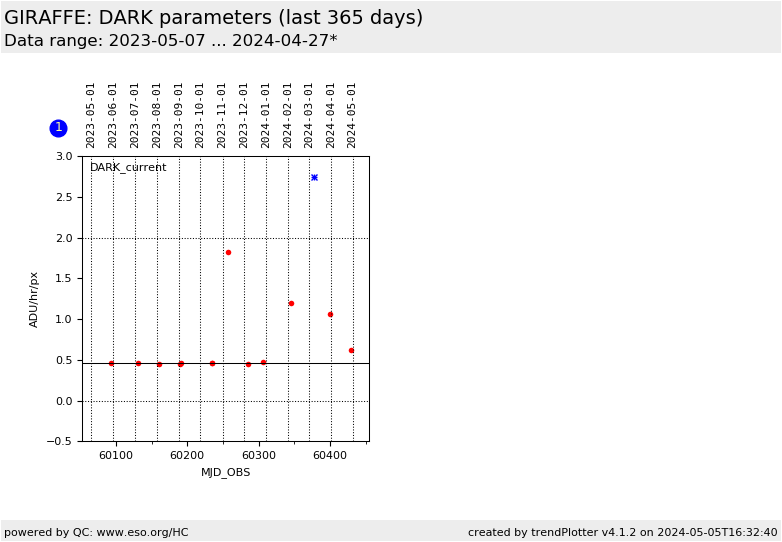
| median: | 0.594 | ADU/hr/px |
| fixed thresholds: | 0...2 | ADU/hr/px |
| N_data plotted: | 14 |
| [click plot for closeup] |
This is the trending plot for the GIRAFFE QC parameters derived from DARK frames.
It combines data from the old
and the new CCD (since 2008-05).
These frames are taken approximately once per month, as a set of 3 consecutive
exposures of 3600 secs each. These data are de-biased and combined into a
MASTER_DARK, in which the average dark level is measured (in ADU/px/hr).
Box 1 has the DARK current, in ADU/hr/pix. For the new CCD, it is measured across the whole
chip.
The old CCD (used until 2008-03) had a significant glow, and the DARK current
was
measured outside the glow, in a box extending up to row @3800.
Box 2 is displayed in history plots up to 2008. It measures the glow
itself.
Note that there was no glow between 2003-07 and 2004-07-26.
Find more information about GIRAFFE DARK frames
here.
Other QC parameters related to detector properties (like contamination,
linearity, gain) are trended in the same group.
General information
Click on any of the plots to see a close-up version.
The latest date is indicated on top of the plot.
If configured,
- data points belonging to the latest date are specially marked
- statistical averages are indicated by a solid line, and thresholds by broken lines
- outliers are marked by a red asterisk. They are defined as data points outside the
threshold lines
- "aliens" (= data points outside the plot Y limits) are marked by a red arrow (↑ or ↓)
- you can download the data for each parameter set if the 'Data downloads' link shows up
|
