Plot
? |
Symb
? |
Source
* |
OPS?
** |
Average ? |
Thresholds ? |
N_
data |
QC1
parameter |
Data
downloads |
Remarks |
| method |
value |
unit |
method |
value |
| 1 |
o | QC1DB |
yes (0) |
MEDIAN |
1.59e+04 |
ratio |
VAL | -0.05,0.05 |
4 |
qc_detlin_eff |
this |
last_yr |
all
|
SW-arm, DoubleCorr nonlinearity correction fraction at 10000 ADU |
| 2 |
o | QC1DB |
yes (0) |
MEDIAN |
0.024 |
ratio |
VAL | 0.02,0.04 |
3 |
qc_detlin_eff |
this |
last_yr |
all
|
LW, UncorrHighBias nonlinearity correction fraction at 10000 ADU |
| 3 |
o | QC1DB |
yes (0) |
MEDIAN |
-53.3 |
ratio |
none | |
4 |
qc_detlin_eff |
this |
last_yr |
all
|
LW, DoubleCorrHighBias nonlinearity correction fraction at 10000 ADU |
| 4 |
o | QC1DB |
yes (0) |
MEDIAN |
-1.11e+05 |
ratio |
none | |
5 |
qc_detlin_eff |
this |
last_yr |
all
|
LW, DoubleCorrLowBias nonlinearity correction fraction at 10000 ADU |
| |
|
*Data sources: QC1DB: QC1 database; LOCAL: local text file | **OPS: OPSLOG data are included
|
Plot 1
scores: not implemented
| | data source: | isaac_line
(QC1 database) |
| dataset: | qc_detlin_eff | o |
| median: | 1.59e+04 | ratio |
| fixed thresholds: | -0.05...0.05 | ratio |
| N_data plotted: | 4 |
| [click on plot for closeup] |
Plot 2
scores: not implemented
| | data source: | isaac_line
(QC1 database) |
| dataset: | qc_detlin_eff | o |
| median: | 0.024 | ratio |
| fixed thresholds: | 0.02...0.04 | ratio |
| N_data plotted: | 3 |
| [click on plot for closeup] |
Plot 3
scores: not implemented
| | data source: | isaac_line
(QC1 database) |
| dataset: | qc_detlin_eff | o |
| median: | -53.3 | ratio |
| thresholds: | none | |
| N_data plotted: | 4 |
| [click on plot for closeup] |
Plot 4
scores: not implemented
| | data source: | isaac_line
(QC1 database) |
| dataset: | qc_detlin_eff | o |
| median: | -1.11e+05 | ratio |
| thresholds: | none | |
| N_data plotted: | 5 |
| [click on plot for closeup] |
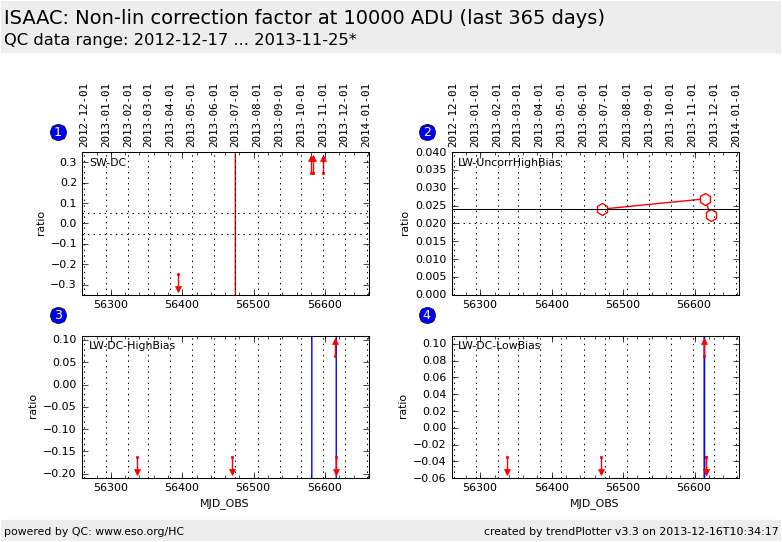
This is the trending plot for the ISAAC
Linearity calibration frames.
The non-linearity polynom is :
counts_corrected = counts_meas + B/A * counts_meas^2 + C/A * counts_meas^3
Dividing by counts_meas, and subtracting 1 and apply the
formular for a reference count level of 10 000 ADU we get:
lin_eff (10000 ADU) = ( counts_corr / counts_meas ) - 1 =
B/A * 10000 + C/A * 10000 * 10000 =
These plots describe:
1. SW, DoubleCorr
2. LW, UncorrHighBias
3. LW, DoubleCorrHighBias
4. LW, DoubleCorrLowBias
Find more information about ISAAC Linearity frames
here.
Other QC parameters related to detector properties
(like
read noise,
are trended.
General information
Click on any of the plots to see a close-up version.
If applicable, the latest values from Paranal ops logs are plotted as blue dots. More information about those values, including a download option, is available in the OPS column.
The latest date is indicated on top of the plot, data points belonging to that date are specially marked.
If configured,
- statistical averages are indicated by a solid line, and thresholds by broken lines
- outliers are marked by a red asterisk. They are defined as data points outside the
threshold lines
- "aliens" (= data points outside the plot Y limits) are marked by a red arrow (↑ or ↓)
- you can download the data for each parameter set if the 'Data downloads' link shows up
|
