Quality Control and
Data Processing
|
NACO: Dark
A number of DARK frames is taken within the NACO daytime calibrations in case NACO science observations have been acquired in the night. Each DARK consists of 3 raw frames obtained with the instrumental setting matching the one used for science observations. The parameters matched are:
In addition, each day, 3 dark frames are taken for the health check purpose, always with the same setup:
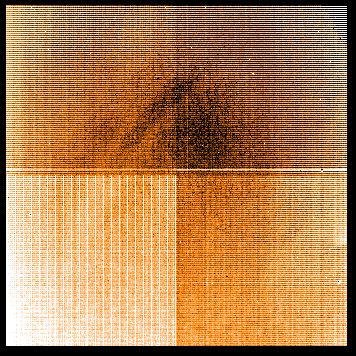
They are utilized to monitor performance of the NACO detector. The following images are from 2016-11-28.
In addition to the QC parameters calculated by the NACO dark pipeline recipe, several QC parameters are calculated by QC procedures. They all are stored in the NACO QC1 parameter database. The NACO detector can be operated in normal (DET.FRAM.TYPE=INT) and in cube mode (DET.FRAM.TYPE=CUBE2). In cube mode, the detector adds two more rows at the upper rim, that the read-out size is 1024x1026 pixel instead of the 1024x1024 pixel in normal read mode. Furthermore the detector can be operated in any used-defined window read out mode. The QC monitoring covers:
Window read out options other than 512 x 512 and 512 x 514 are not pipeline supported and are not subject of QC checks. In addition to the trending plots which show the evolution of the QC parameter with time, we provide a diagnostic plot, which shows the relation between the dark level and the exposure time to document the reduction of dark current since 2015. The operationally most critical detector characteristics derived from dark calibration frames are monitored by the following four QC parameters:  Readout noise
The read out noise is the signal scatter when no light enters the detector. It is a basic property of the detector (of each pixel) and can be derived by multiple read outs. We monitor the NACO detector read out in all detector read modes and DIT.
The readout noise is plotted in boxes 1,2 and 3 of the trending plot. Scoring&thresholds Readout noise Scoring thresholds have been chosen to be slightly more tolerant than 3 sigma, where sigma is the scatter of the data RON values acquired after 2016-01. The stability of the readout noise since start of operations in 2004 is documented here where the green points refer to values of the replaced detector from 2015 on. The detector readout noise for DIT=300s, Fowler sampling read mode is highly contaminated by the light leakage. The readout noise is calculated from the 2nd-1st raw dark frame; it is a median of the standard deviations measured from 100 4x4 windows on the difference frame, multiplied by sqrt(NDIT/2)
Dark level
The dark level is the mean signal achieved from a detector when no light enters the detector. In double correlated read mode, when two signals are subtracted from each other, the dark level should be around zero for small DIT and should linearly increase with time for longer exposure times. In uncorrelated read mode, the dark level is the configured bias level (for short DIT) and can be negative ( ~ -3000 ADU).
The dark level is plotted in boxes 4,5 and 6 of the trending plot. The dark level is scored. Thresholds have been derived from the scatter in the dark level from data acquired after 2015-06.
The median dark level of the master dark excludes the region of a 100 pixel wide stripe at the rim of the detector.
Hot and cold pixel
The number of hot and cold pixel are derived from master dark products.
The definition of the hot and cold pixel makes only sense, when the master dark is flat, which is fulfilled for the short exposure time Uncorr and Double read modes. Since 2015, the known light leakage produces even brighter diagonal stripes than before 2015. Therefore the hot pixel registered in DIT=300sec Fowler sampling are pixel contaminated by the light leakage. Scoring&thresholds Hot and cold pixel These detector engineering QC parameters are not scored. Hot and cold pixel are not propagated in the data reduction cascade. before 2015, another detector was in operation, hot and cold pixel have been derived using the pipeline default parameters TH=10 and TC=6. Count the number of pixel in the master dark with more then TH ADU above the median level and less than TC ADU below the median dark level.
|
||||||||||||||||||||||||||||||||||||||||||||||||||||||||||||||||||||||||||||||||||||||||||||||||||||||||||||||||||||||||||||||||||||||||||||||||||||||||||||||||||||||||||||||||||||||||||||||||||||||||||||||||||||||||||||||||||||||||||||||||||||||||||||||||||||||||||||||||||||||||||||||||||||||||||||||||||||||||||||||||||||||||||||||||||||||||||||||||||||||||||||||||||||||||||||||||||||||||||||||||||||||||||||||||||||||||||||||||||||||||||||||||||||||||||||||||||||||||||||||||||||||||||||||||||||||||||||||||||||||||||
| |
|||||||||||||||||||||||||||||||||||||||||||||||||||||||||||||||||||||||||||||||||||||||||||||||||||||||||||||||||||||||||||||||||||||||||||||||||||||||||||||||||||||||||||||||||||||||||||||||||||||||||||||||||||||||||||||||||||||||||||||||||||||||||||||||||||||||||||||||||||||||||||||||||||||||||||||||||||||||||||||||||||||||||||||||||||||||||||||||||||||||||||||||||||||||||||||||||||||||||||||||||||||||||||||||||||||||||||||||||||||||||||||||||||||||||||||||||||||||||||||||||||||||||||||||||||||||||||||||||||||||||||
 |
|
||||||||||||||||||||||||||||||||||||||||||||||||||||||||||||||||||||||||||||||||||||||||||||||||||||||||||||||||||||||||||||||||||||||||||||||||||||||||||||||||||||||||||||||||||||||||||||||||||||||||||||||||||||||||||||||||||||||||||||||||||||||||||||||||||||||||||||||||||||||||||||||||||||||||||||||||||||||||||||||||||||||||||||||||||||||||||||||||||||||||||||||||||||||||||||||||||||||||||||||||||||||||||||||||||||||||||||||||||||||||||||||||||||||||||||||||||||||||||||||||||||||||||||||||||||||||||||||||||||||||||