Plot
? |
Symb
? |
Source
* |
Average ? |
Thresholds ? |
N_
data |
QC1
parameter |
Data
downloads |
Remarks |
| method |
value |
unit |
method |
value |
| 1 |
• | QC1DB |
none |
|
ratio |
none | |
54 |
fpn_norm |
this |
last_yr |
all
|
fpn ratio, for any Filter, S13, Double_RdRstRd (and DIT=15sec) |
| 1 |
• | QC1DB |
none |
|
ratio |
none | |
16 |
fpn_norm |
this |
last_yr |
all
|
fpn ratio, for J, S13, Double_RdRstRd (and DIT=15sec) |
| 1 |
• | QC1DB |
none |
|
ratio |
none | |
15 |
fpn_norm |
this |
last_yr |
all
|
fpn ratio, for H, S13, Double_RdRstRd (and DIT=15sec) |
| 1 |
• | QC1DB |
none |
|
ratio |
none | |
17 |
fpn_norm |
this |
last_yr |
all
|
fpn ratio, for Ks, S13, Double_RdRstRd (and DIT=15sec) |
| 2 |
• | QC1DB |
none |
|
ratio |
none | |
19 |
fpn_norm |
this |
last_yr |
all
|
fpn ratio, for any Filter, S13, FowlerNsamp (and DIT=15sec) |
| 2 |
• | QC1DB |
none |
|
ratio |
none | |
1 |
fpn_norm |
this |
last_yr |
all
|
fpn ratio, for J, S13, FowlerNsamp (and DIT=15sec) |
| 2 |
• | QC1DB |
none |
|
ratio |
none | |
1 |
fpn_norm |
this |
last_yr |
all
|
fpn ratio, for H, S13, FowlerNsamp (and DIT=15sec) |
| 2 |
• | QC1DB |
none |
|
ratio |
none | |
8 |
fpn_norm |
this |
last_yr |
all
|
fpn ratio, for Ks, S13, FowlerNsamp (and DIT=15sec) |
| |
|
*Data sources: QC1DB: QC1 database; LOCAL: local data source
|
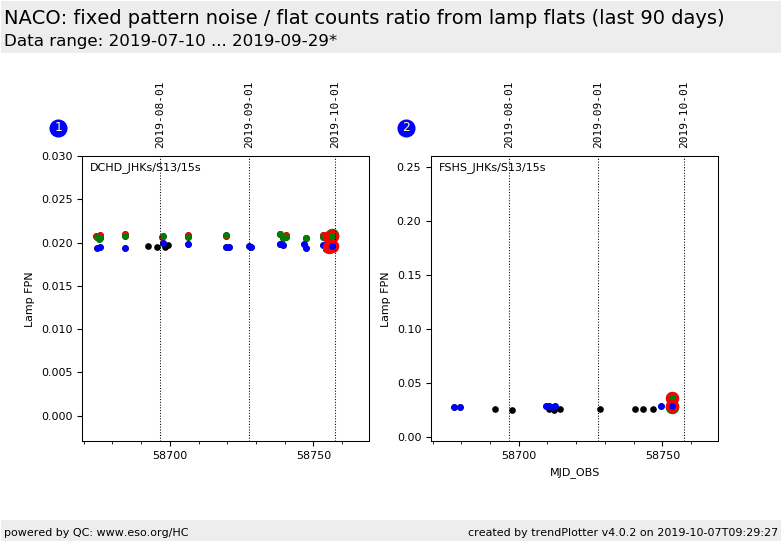
Plot 1
scores: not implemented
| | data source: | naco_lampflat
(QC1 database) |
dataset:
(numbers below apply to this dataset) | fpn_norm | • |
| average: | none |
| thresholds: | none |
| N_data plotted: | 54 |
| [click plot for closeup] |
Plot 2
scores: not implemented
| | data source: | naco_lampflat
(QC1 database) |
dataset:
(numbers below apply to this dataset) | fpn_norm | • |
| average: | none |
| thresholds: | none |
| N_data plotted: | 19 |
| [click plot for closeup] |
Normalized fixed pattern noise.
Fixed pattern noise (fpn QC1 parameter) divided by the flat counts
(flat_med_max QC1 parameter) in order to obtain a structural noise
(fpn_norm QC1 parameter) value independent on the lamp flat counts.
The data points are separated according to read mode:
- Double_RdRstRd HighDensity, DIT=15sec, S13, J, H or Ks filter
- FowlerNsamp HighSensitivity, DIT=15sec, S13, J, H or Ks filter
Plot will be maintained as a fallback solution for the unreliable fp noise values
currently
derived from the detmon data.
The fractional fixed pattern noise in fowler sampling mode is dominated by the
diagonal stripe shaped light contamination.
General information
Click on any of the plots to see a close-up version.
The latest date is indicated on top of the plot.
If configured,
- data points belonging to the latest date are specially marked
- statistical averages are indicated by a solid line, and thresholds by broken lines
- outliers are marked by a red asterisk. They are defined as data points outside the
threshold lines
- "aliens" (= data points outside the plot Y limits) are marked by a red arrow (↑ or ↓)
- you can download the data for each parameter set if the 'Data downloads' link shows up
|
