[page auto-refreshes after 300 sec]   [stop | on]            [press Ctrl+Shift+R to enforce refresh of scores, dates and news]
NACO trending system: HEALTH CHECK report
HELP USERS-GUIDE MORE
Last update: 2016-10-17T09:55:47 (UT)
  | now: 2024-04-25T00:36:44 (UT) muc04 QC pipeline: naco-4.4.1 (installed 2016-03-17)
same group: zeropoints
close window history: 2004 2005 2006 2007 2008 2009 2010 2011 2012 2013 2014   2015   HEALTH
  ... ... ... ... ... ... ... ... ... ...
*Date on this monitor changes at 21:00 UT
Print: Information and research:
- png file - advanced studies: QC1 browser | QC1 plotter
Plot
?
Symb
?
Source
*
Average ? Thresholds ? N_
data
QC1
parameter
Data
downloads
Remarks
method value unit method value
1 QC1DB none     VAL22.5,23.6 25 zpoint this | last_yr | all Ks zeropoints for all cameras/dichroics
1 QC1DB MEAN 23.3   VAL22.5,23.6 8 zpoint this | last_yr | all Ks zeropoints for S27 camera and VIS dichroic
2 QC1DB none     VAL23.8,24.5 21 zpoint this | last_yr | all H zeropoints for all cameras/dichroics
2 QC1DB MEAN 24.2   VAL23.8,24.5 5 zpoint this | last_yr | all H zeropoints for S27 camera and VIS dichroic
3 QC1DB none     VAL23.9,24.7 8 zpoint this | last_yr | all J zeropoints for all cameras/dichroics
3 QC1DB MEAN 24.2   VAL23.9,24.7 2 zpoint this | last_yr | all J zeropoints for S27 camera and VIS dichroic
*Data sources: QC1DB: QC1 database; LOCAL: local data source
Plot 1
scores: multiple dataset, cannot be scored
data source:naco_zp
(QC1 database)
dataset:
(numbers below apply to this dataset)
zpoint
average:none
fixed thresholds:22.5...23.6 
N_data plotted:25
[click on plot for closeup]
Plot 2
scores: multiple dataset, cannot be scored
data source:naco_zp
(QC1 database)
dataset:
(numbers below apply to this dataset)
zpoint
average:none
fixed thresholds:23.8...24.5 
N_data plotted:21
[click on plot for closeup]
Plot 3
scores: multiple dataset, cannot be scored
data source:naco_zp
(QC1 database)
dataset:
(numbers below apply to this dataset)
zpoint
average:none
fixed thresholds:23.9...24.7 
N_data plotted:8
[click on plot for closeup]
This plot

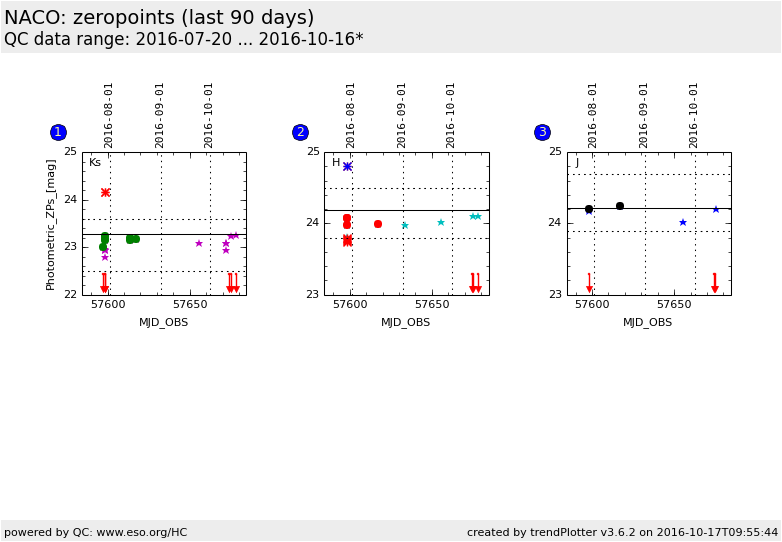
Photometric Zeropoints (not corrected for extinction) are shown for three broad band filters Ks, H and J. They were estimated from the standard star observations taken in all cameras and dichroics.  


General information

Click on any of the plots to see a close-up version.

The latest date is indicated on top of the plot.

If configured,

  • data points belonging to the latest date are specially marked
  • statistical averages are indicated by a solid line, and thresholds by broken lines
  • outliers are marked by a red asterisk. They are defined as data points outside the threshold lines
  • "aliens" (= data points outside the plot Y limits) are marked by a red arrow ( or )
  • you can download the data for each parameter set if the 'Data downloads' link shows up