Plot
? |
Symb
? |
Source
* |
Average ? |
Thresholds ? |
N_
data |
QC1
parameter |
Data
downloads |
Remarks |
| method |
value |
unit |
method |
value |
| 1 |
• | QC1DB |
MEDIAN |
2.12 |
ADU |
VAL | 2.03,2.43 |
47 |
sigma_raw |
this |
last_yr |
all
|
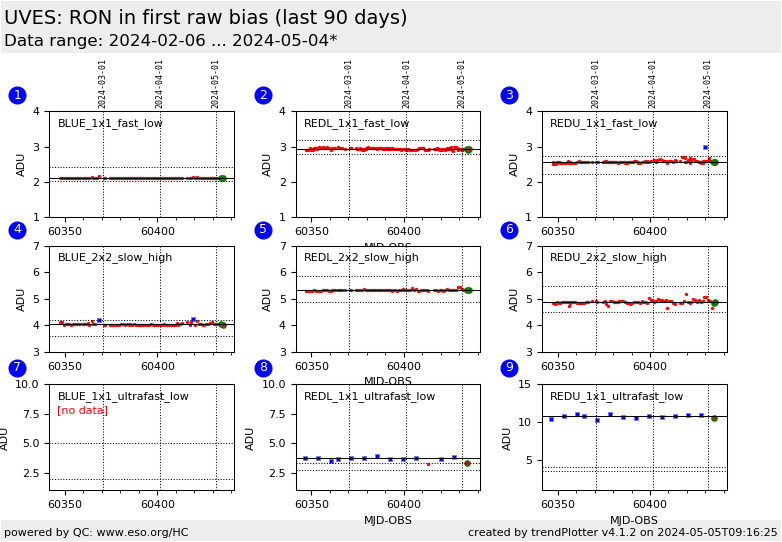
RON in first raw bias frame, BLUE CCD, readout mode 225kHz,1x1,low
|
| 2 |
• | QC1DB |
MEDIAN |
3.16 |
ADU |
VAL | 2.8,3.2 |
67 |
sigma_raw |
this |
last_yr |
all
|
same, for REDL CCD |
| 3 |
• | QC1DB |
MEDIAN |
2.83 |
ADU |
VAL | 2.24,2.74 |
67 |
sigma_raw |
this |
last_yr |
all
|
same, for REDU CCD |
| 4 |
• | QC1DB |
MEDIAN |
4.05 |
ADU |
VAL | 3.59,4.19 |
45 |
sigma_raw |
this |
last_yr |
all
|
same as Fig. 1, for readout mode 50kHz,2x2,high
|
| 5 |
• | QC1DB |
MEDIAN |
5.49 |
ADU |
VAL | 4.88,5.88 |
45 |
sigma_raw |
this |
last_yr |
all
|
same, for REDL CCD |
| 6 |
• | QC1DB |
MEDIAN |
5.71 |
ADU |
VAL | 4.5,5.5 |
45 |
sigma_raw |
this |
last_yr |
all
|
same, for REDU CCD |
| 7 |
• | QC1DB |
MEDIAN |
|
ADU |
VAL | 2,5 |
0 |
sigma_raw |
this |
last_yr |
all
|
RON in first raw bias frame, BLUE CCD, readout mode 625kHz,1x1,low
|
| 8 |
• | QC1DB |
MEDIAN |
3.24 |
ADU |
VAL | 2.70,3.3 |
8 |
sigma_raw |
this |
last_yr |
all
|
same, for REDL CCD |
| 9 |
• | QC1DB |
MEDIAN |
5.7 |
ADU |
VAL | 3.5,4.1 |
8 |
sigma_raw |
this |
last_yr |
all
|
same, for REDU CCD |
| |
|
*Data sources: QC1DB: QC1 database; LOCAL: local data source
|
Plot 1
scores:  7| 7|
| | data source: | uves_bias
(QC1 database) |
| dataset: | sigma_raw | • |
| median: | 2.12 | ADU |
| fixed thresholds: | 2.03...2.43 | ADU |
| N_data plotted: | 47 |
| [click plot for closeup] |
Plot 2
scores:  9| 9|
| | data source: | uves_bias
(QC1 database) |
| dataset: | sigma_raw | • |
| median: | 3.16 | ADU |
| fixed thresholds: | 2.8...3.2 | ADU |
| N_data plotted: | 67 |
| [click plot for closeup] |
Plot 3
scores: 9|
| | data source: | uves_bias
(QC1 database) |
| dataset: | sigma_raw | • |
| median: | 2.83 | ADU |
| fixed thresholds: | 2.24...2.74 | ADU |
| N_data plotted: | 67 |
| [click plot for closeup] |
Plot 4
scores: 7|
| | data source: | uves_bias
(QC1 database) |
| dataset: | sigma_raw | • |
| median: | 4.05 | ADU |
| fixed thresholds: | 3.59...4.19 | ADU |
| N_data plotted: | 45 |
| [click plot for closeup] |
Plot 5
scores: 7|
| | data source: | uves_bias
(QC1 database) |
| dataset: | sigma_raw | • |
| median: | 5.49 | ADU |
| fixed thresholds: | 4.88...5.88 | ADU |
| N_data plotted: | 45 |
| [click plot for closeup] |
Plot 6
scores: 7|
| | data source: | uves_bias
(QC1 database) |
| dataset: | sigma_raw | • |
| median: | 5.71 | ADU |
| fixed thresholds: | 4.5...5.5 | ADU |
| N_data plotted: | 45 |
| [click plot for closeup] |
Plot 7
scores: not implemented
| | data source: | uves_bias
(QC1 database) |
| dataset: | sigma_raw | • |
| median: | no data | ADU |
| fixed thresholds: | 2...5 | ADU |
| N_data plotted: | 0 |
| [click plot for closeup] |
Plot 8
scores: not implemented
| | data source: | uves_bias
(QC1 database) |
| dataset: | sigma_raw | • |
| median: | 3.24 | ADU |
| fixed thresholds: | 2.7...3.3 | ADU |
| N_data plotted: | 8 |
| [click plot for closeup] |
Plot 9
scores: not implemented
| | data source: | uves_bias
(QC1 database) |
| dataset: | sigma_raw | • |
| median: | 5.7 | ADU |
| fixed thresholds: | 3.5...4.1 | ADU |
| N_data plotted: | 8 |
| [click plot for closeup] |
This is the trending report for the UVES QC parameters derived from BIAS frames.
These plots describe:
- the read noise (RON) of a single raw frame of the BLUE chip in different binnings and gain
- the read noise (RON) of a single raw frame of the REDL chip in different binnings and gain
- the read noise (RON) of a single raw frame of the REDU chip in different binnings and gain
Most of the BIAS observations are taken with 5 files in the template.
The user manual values (in e-) are:
- plot1: 4.1 BLUE fast read-out low gain 225kHz/lg
- plot2: 4.2 RED EEV (CHIPL CCD-44 CHIP2) fast read-out low gain 225kHz/lg
- plot3: 3.7 RED MIT (CHIPU CCD-20 CHIP1) fast read-out low gain 225kHz/lg
- plot4: 2.1 BLUE slow read-out high gain 50kHz/hg
- plot5: 2.8 RED EEV slow read-out high gain 50kHz/hg
- plot6: 2.1 RED MIT slow read-out high gain 50kHz/hg
- no value for BLUE ultra fast read-out low gain 625kHz/lg
- plot9: 4.3 RED EEV ultra fast read-out low gain 625kHz/lg
- plot8: 4.7 RED MIT ultra fast read-out low gain 625kHz/lg
The thresholds are set as -+10% of nominal values (from the KPI document).
These nominal values are (in ADU)
- BLUE 1x1 1.11
- REDL 1x1 1.57
- REDU 1x1 1.47
- BLUE 2x2 2.21
- REDL 2x2 2.93
- REDU 2x2 2.63
The e- to ADU conversion used are
- BLUE 1x1 1.84 ADU
- REDL 1x1 1.59 ADU
- REDU 1x1 1.46 ADU
- BLUE 2x2 0.54 ADU
- REDL 2x2 0.52 ADU
- REDU 2x2 0.52 ADU
Find more information about UVES BIAS frames here.
Other QC parameters related to detector properties (like linearity, gain) are trended here.
General information
Click on any of the plots to see a close-up version.
The latest date is indicated on top of the plot.
If configured,
- data points belonging to the latest date are specially marked
- statistical averages are indicated by a solid line, and thresholds by broken lines
- outliers are marked by a red asterisk. They are defined as data points outside the
threshold lines
- "aliens" (= data points outside the plot Y limits) are marked by a red arrow (↑ or ↓)
- you can download the data for each parameter set if the 'Data downloads' link shows up
|
