Plot
? |
Symb
? |
Source
* |
Average ? |
Thresholds ? |
N_
data |
QC1
parameter |
Data
downloads |
Remarks |
| method |
value |
unit |
method |
value |
| 1 |
• | QC1DB |
MEDIAN |
0.0086 |
Pix |
VAL | 0.005,0.015 |
44 |
ydiffrms |
this |
last_yr |
all
|
RMS of Y-Differences between the two frames |
| 2 |
• | QC1DB |
MEDIAN |
0.0265 |
Pix |
VAL | 0.010,0.040 |
44 |
ydiffrms |
this |
last_yr |
all
|
same, for CD#2 |
| 3 |
• | QC1DB |
MEDIAN |
0.0188 |
Pix |
VAL | 0.010,0.030 |
42 |
ydiffrms |
this |
last_yr |
all
|
same, for CD#3 |
| 4 |
• | QC1DB |
MEDIAN |
0.0371 |
Pix |
VAL | 0.025,0.055 |
41 |
ydiffrms |
this |
last_yr |
all
|
same, for CD#4 |
| |
|
*Data sources: QC1DB: QC1 database; LOCAL: local data source
|
Plot 1
scores: not implemented
| | data source: | uves_zflat
(QC1 database) |
| dataset: | ydiffrms | • |
| median: | 0.0086 | Pix |
| fixed thresholds: | 0.005...0.015 | Pix |
| N_data plotted: | 44 |
| [click plot for closeup] |
Plot 2
scores: not implemented
| | data source: | uves_zflat
(QC1 database) |
| dataset: | ydiffrms | • |
| median: | 0.0265 | Pix |
| fixed thresholds: | 0.01...0.04 | Pix |
| N_data plotted: | 44 |
| [click plot for closeup] |
Plot 3
scores: not implemented
| | data source: | uves_zflat
(QC1 database) |
| dataset: | ydiffrms | • |
| median: | 0.0188 | Pix |
| fixed thresholds: | 0.01...0.03 | Pix |
| N_data plotted: | 42 |
| [click plot for closeup] |
Plot 4
scores: not implemented
| | data source: | uves_zflat
(QC1 database) |
| dataset: | ydiffrms | • |
| median: | 0.0371 | Pix |
| fixed thresholds: | 0.025...0.055 | Pix |
| N_data plotted: | 41 |
| [click plot for closeup] |
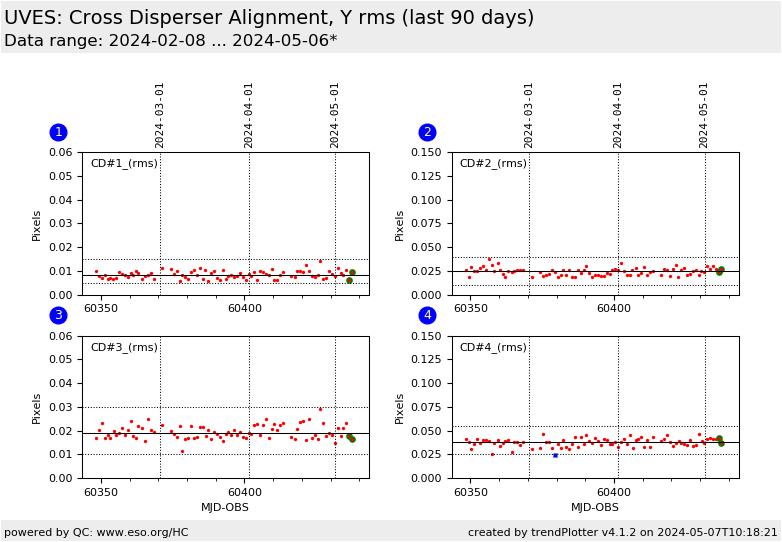
This is the trending report for UVES QC parameters derived from the
Cross-Disperser Alignment reproducibility frames.
These data are taken daily. Each Cross-Disperser [CD] is
moved into position such that the zeroth order from the echelle falls
on the detector and the first frame is exposed, then the CD is moved
away, and then moved back into position and the second frame is
taken. Ideally, if the mechanical mechanisms are working perfectly,
the zeroth order will appear at exactly the same position in the two
frames. So this data tests the reproducability of the instrumental
setup, in particular that the instrumental setups used during the
night can be accurately reproduced during daytime calibrations.
The spatial position of the zeroth order is then measured at a number
(~25) positions along the order in the two frames. Plots 1 to 4 display
the RMS of the differences between the measured positions in the two
frames.
Find more information about UVES CD_ALIGN frames here.
General information
Click on any of the plots to see a close-up version.
The latest date is indicated on top of the plot.
If configured,
- data points belonging to the latest date are specially marked
- statistical averages are indicated by a solid line, and thresholds by broken lines
- outliers are marked by a red asterisk. They are defined as data points outside the
threshold lines
- "aliens" (= data points outside the plot Y limits) are marked by a red arrow (↑ or ↓)
- you can download the data for each parameter set if the 'Data downloads' link shows up
|
