response curves and flux calibration
| HOME | INDEX | SEARCH | HELP | NEWS |
| VIMOS
response curves and flux calibration |
|||||
|
| VIMOS spectrophotometric standard stars | ||||||||||||||||||||||||||||||||||||||||||||||||||||||||||||||||||||||||||||||||||||||||||||||||||||||||||||||||||||||||||||||||||||||||||||||||||||||||||||||||||||||||||||||||||||||||||||||||||||||||||||||||||||||||||||||||||||||||||||||||||||||||||||||||||
|
Purpose Spectrophotometric standard stars are observed for all grisms on a regular basis, dependent on the usage of the settings for science. Their purpose is to monitor the overall instrument efficiency (telescope+instrument+detector) and to provide a measure of the spectral response. They are measured for MOS and IFU separately. Although a single standard star observation may be well suited for providing a response curve for relative flux calibration, usage of individual measurements is often limited due to two reasons: standard stars are not always observed under optimum weather conditions or under conditions similar to the science observation and instrumental instabilities or scheduling requirements may prevent observation of standards in time. Master Response Curves
In order to handle the above mentioned shortcomings, standardized response curves which are averaged from individual measurements over a dedicated time period can be very helpful. Such curves are called master response curves in the following. The VIMOS pipeline extracts standard star spectra for MOS in the same way as science observations. In case of IFU, the fibre spectra are, in addition to the procedure for science, also sky subtracted and summed. The response curve is calculated as:
with
Master response curves have been created from pipeline-reduced standard star observations by applying the following steps:
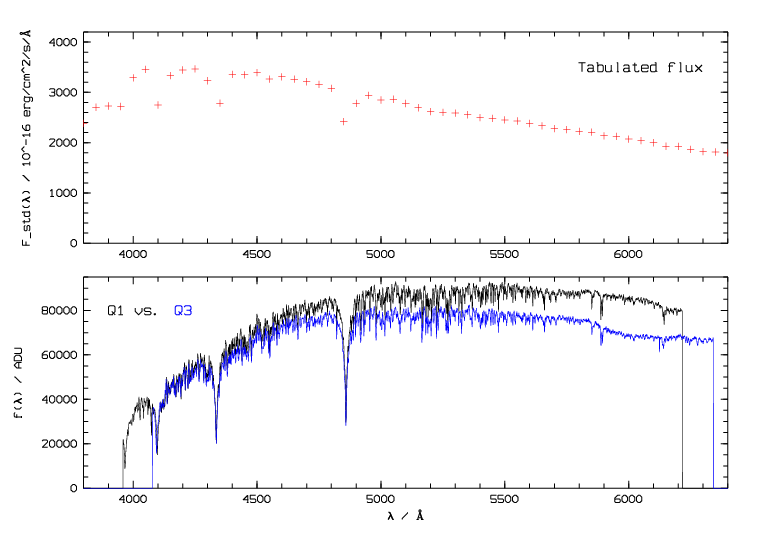
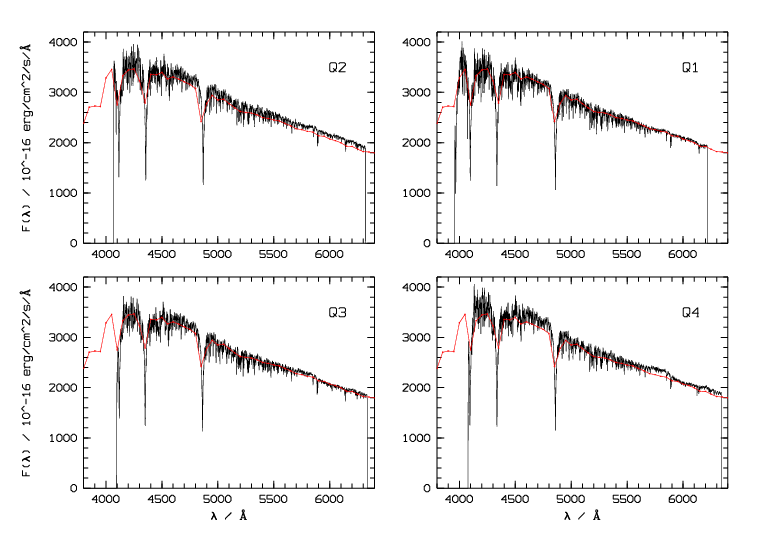
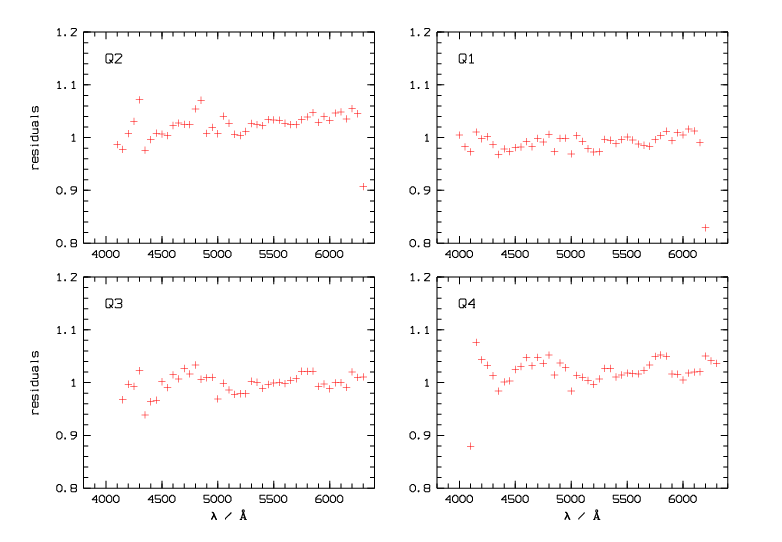
Verification For verification of the master response curves, several standard star observations for all settings have been treated as science and the extracted spectra have been flux-calibrated using the master curves. The results have been compared to the tabulated flux values. Example for MOS: Observation of CD -32 9927 from 2006-03-31 with HR_blue grism (no filter). The left image shows the tabulated flux and the extracted spectra (not flux-calibrated) from quadrants 1 and 3. The spectra differ significantly at longer wavelengths. In the middle image, the flux-calibrated spectra from all four quadrants are compared to the tabulated flux. The spectra from all quadrants have nearly the same level now. The right image shows the flux-calibrated spectra divided by the tabulated flux. These residuals are better than 10% over most of the spectral range.
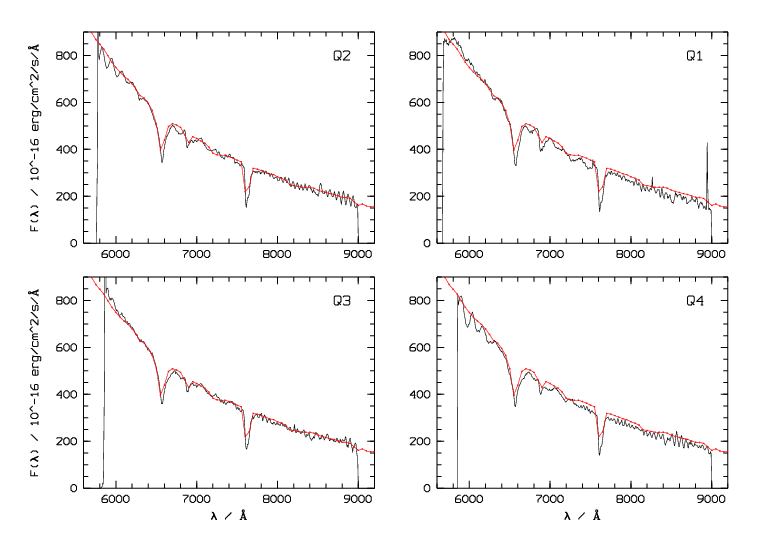
Example for IFU: Observation of EG 21 from 2006-08-23 with LR_red grism, OS-red filter, and 2:1 IFU magnification. The spectra from all fibres have been summed and an estimated background subtracted (black curves). The tabulated flux is shown in red. (Please note that the binning of the tabulated flux is much lower than the resolution of the extracted spectra.) The observations show artefacts from filter transmission (not corrected during reduction) but the overall level agrees well.
Accuracy and limitations: Comparison of flux-calibrated spectra
with tabulated flux values show that, in general, an accuracy of 10% can
be achieved for relative calibration within each spectrum. The master
response curves represent, however, a snap shot in time and changes in
the overall efficiency of the telescope+instrument cannot be accounted. Availability and Usage Master response curves have been created for most MOS and IFU settings. Details can be found in the tables below. The response curves for the HR_red grism apply only to the new holographic grisms which are operational since November 2005. Please note that the VIMOS detectors have been exchanged in June 2010. Two different sets of response curves are, therefore, available which should be used for data obtained until May 2010 or after August 2010, respectively. Table 1: available MOS settings. The time range from which standard star observations have been taken is indicated. The number of actually used observations for averaging can vary between quadrants.
Table 2: available IFU settings. The time range from which standard star observations have been taken is indicated. The number of actually used observations for averaging can vary between quadrants.
Usage: Master response curves R_mst can be applied by hand to extracted spectra with the following procedure:
with f_raw in electrons/s/A. The VIMOS pipeline flux-calibrates spectra when a response curve is provided with the tags MOS_SPECPHOT_TABLE or IFU_SPECPHOT_TABLE, respectively, in the set of frames and if the appropriate recipe options are set (--photometry=true in case of vmmosscience and --CalibrateFlux=true for vmifuscience). Download Sets of master response curves for MOS and IFU are available as tar files:
The file names have the following formats. For MOS:
For IFU:
With:
The response files are fits tables with 7 columns for compatibility with the VIMOS pipeline but only columns 1 (WAVE) and 7 (RESPONSE) are filled.
|
||||||||||||||||||||||||||||||||||||||||||||||||||||||||||||||||||||||||||||||||||||||||||||||||||||||||||||||||||||||||||||||||||||||||||||||||||||||||||||||||||||||||||||||||||||||||||||||||||||||||||||||||||||||||||||||||||||||||||||||||||||||||||||||||||