Plot
? |
Symb
? |
Source
* |
Average ? |
Thresholds ? |
N_
data |
QC1
parameter |
Data
downloads |
Remarks |
| method |
value |
unit |
method |
value |
| 1 |
• | QC1DB |
MEDIAN |
1.06e+06 |
ADU/s |
VAL | 0.8E6,1.3E6 |
151 |
flux |
this |
last_yr |
all
|
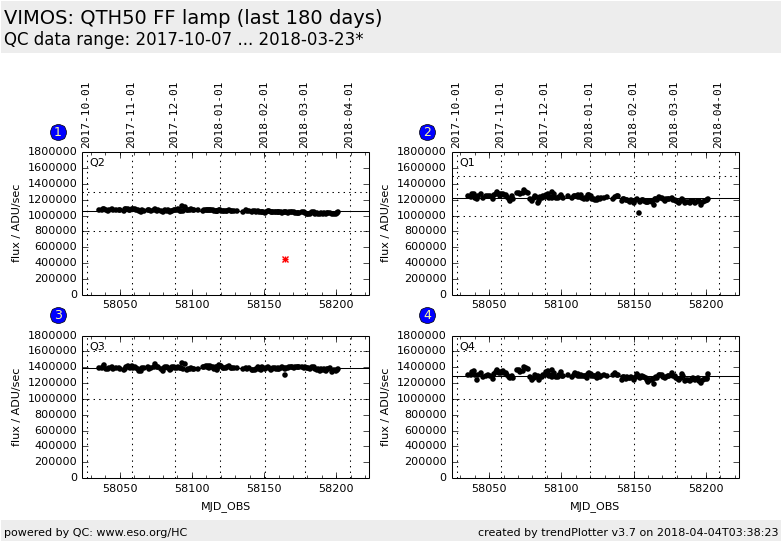
Q2, flux from IFU flats |
| 2 |
• | QC1DB |
MEDIAN |
1.22e+06 |
ADU/s |
VAL | 1.0E6,1.5E6 |
151 |
flux |
this |
last_yr |
all
|
Q1, flux from IFU flats |
| 3 |
• | QC1DB |
MEDIAN |
1.39e+06 |
ADU/s |
VAL | 1.0E6,1.6E6 |
151 |
flux |
this |
last_yr |
all
|
Q3, flux from IFU flats |
| 4 |
• | QC1DB |
MEDIAN |
1.28e+06 |
ADU/s |
VAL | 1.0E6,1.6E6 |
151 |
flux |
this |
last_yr |
all
|
Q4, flux from IFU flats |
| |
|
*Data sources: QC1DB: QC1 database; LOCAL: local data source
|
Plot 1
scores:  7| 7|
| | data source: | vimos_ifu_score
(QC1 database) |
| dataset: | flux | • |
| median: | 1.06e+06 | ADU/s |
| fixed thresholds: | 800000.0...1300000.0 | ADU/s |
| N_data plotted: | 151 |
| [click plot for closeup] |
Plot 2
scores: 7|
| | data source: | vimos_ifu_score
(QC1 database) |
| dataset: | flux | • |
| median: | 1.22e+06 | ADU/s |
| fixed thresholds: | 1000000.0...1500000.0 | ADU/s |
| N_data plotted: | 151 |
| [click plot for closeup] |
Plot 3
scores: 7|
| | data source: | vimos_ifu_score
(QC1 database) |
| dataset: | flux | • |
| median: | 1.39e+06 | ADU/s |
| fixed thresholds: | 1000000.0...1600000.0 | ADU/s |
| N_data plotted: | 151 |
| [click plot for closeup] |
Plot 4
scores: 7|
| | data source: | vimos_ifu_score
(QC1 database) |
| dataset: | flux | • |
| median: | 1.28e+06 | ADU/s |
| fixed thresholds: | 1000000.0...1600000.0 | ADU/s |
| N_data plotted: | 151 |
| [click plot for closeup] |
Trending plot for the QTH50 FF lamp.
The lamp performance is measured using IFU spectroscopic flats.
The same lamp is also used for MOS spectroscopic flats with HR grisms and
imaging screen flats with U and B filters.
The values should show smooth trending without sudden jumps.
Only day-time measurements with HR_orange are plotted. These are usually
measured daily.
Template ID: ifu_cal_DayCalib: Pipeline recipe: vmifucalib.
General information
Click on any of the plots to see a close-up version.
The latest date is indicated on top of the plot.
If configured,
- data points belonging to the latest date are specially marked
- statistical averages are indicated by a solid line, and thresholds by broken lines
- outliers are marked by a red asterisk. They are defined as data points outside the
threshold lines
- "aliens" (= data points outside the plot Y limits) are marked by a red arrow (↑ or ↓)
- you can download the data for each parameter set if the 'Data downloads' link shows up
|
