Plot
? |
Symb
? |
Source
* |
Average ? |
Thresholds ? |
N_
data |
QC1
parameter |
Data
downloads |
Remarks |
| method |
value |
unit |
method |
value |
| 1 |
• | QC1DB |
MEDIAN |
6 |
none |
VAL | 0,50 |
73 |
wave_lost2 |
this |
last_yr |
all
|
number of lost fibres on pseudo slit 2 |
| 2 |
• | QC1DB |
MEDIAN |
20 |
none |
VAL | 0,50 |
73 |
wave_lost2 |
this |
last_yr |
all
|
number of lost fibres on pseudo slit 2 |
| 3 |
• | QC1DB |
MEDIAN |
20 |
none |
VAL | 0,50 |
73 |
wave_lost2 |
this |
last_yr |
all
|
number of lost fibres on pseudo slit 2 |
| 4 |
• | QC1DB |
MEDIAN |
40 |
none |
VAL | 0,50 |
73 |
wave_lost2 |
this |
last_yr |
all
|
number of lost fibres on pseudo slit 2 |
| |
|
*Data sources: QC1DB: QC1 database; LOCAL: local data source
|
Plot 1
scores:  7| 7|
| | data source: | vimos_ifu_score
(QC1 database) |
| dataset: | wave_lost2 | • |
| median: | 6 | none |
| fixed thresholds: | 0...50 | none |
| N_data plotted: | 73 |
| [click plot for closeup] |
Plot 2
scores: 7|
| | data source: | vimos_ifu_score
(QC1 database) |
| dataset: | wave_lost2 | • |
| median: | 20 | none |
| fixed thresholds: | 0...50 | none |
| N_data plotted: | 73 |
| [click plot for closeup] |
Plot 3
scores: 7|
| | data source: | vimos_ifu_score
(QC1 database) |
| dataset: | wave_lost2 | • |
| median: | 20 | none |
| fixed thresholds: | 0...50 | none |
| N_data plotted: | 73 |
| [click plot for closeup] |
Plot 4
scores: 7|
| | data source: | vimos_ifu_score
(QC1 database) |
| dataset: | wave_lost2 | • |
| median: | 40 | none |
| fixed thresholds: | 0...50 | none |
| N_data plotted: | 73 |
| [click plot for closeup] |
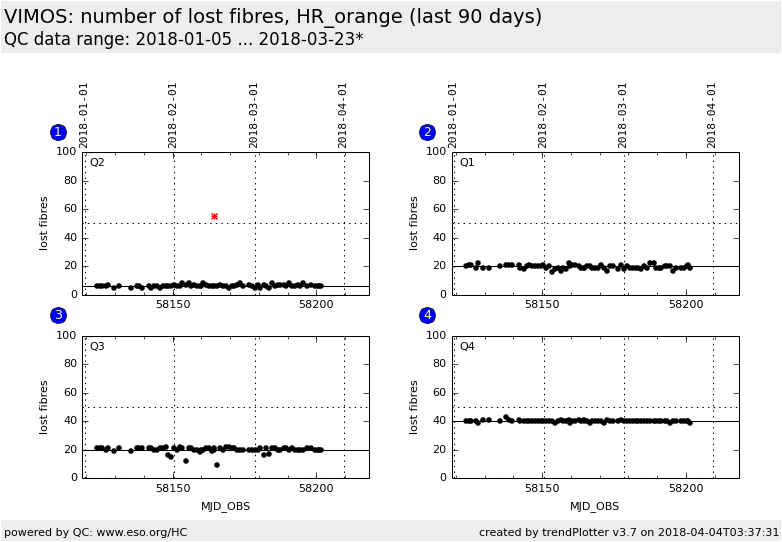
Trending plot for number of not successfully found, traced, and
wavelength-calibrated fibres in IFU calibrations.
The LR grisms have four pseudo slits; wave_lost is determined separately for
each but scored only for pseudo slit 2. Only measurements executed with
IFU shutter OFF are plotted. MR and HR grisms use
pseudo slit 2 only.
Historical trending plots show only the number of fibres that could not be
successfully identified from IFU flat-field calibrations (QC parameter
num_lost). Beginning with
October 2009, trending also includes those fibres that could not be
wavelength calibrated (QC parameter wave_lost).
Template ID: ifu_cal_DayCalib (daytime Health Checks), ifu_cal_NightCalib
(attached night-time). Pipeline recipe: vmifucalib.
General information
Click on any of the plots to see a close-up version.
The latest date is indicated on top of the plot.
If configured,
- data points belonging to the latest date are specially marked
- statistical averages are indicated by a solid line, and thresholds by broken lines
- outliers are marked by a red asterisk. They are defined as data points outside the
threshold lines
- "aliens" (= data points outside the plot Y limits) are marked by a red arrow (↑ or ↓)
- you can download the data for each parameter set if the 'Data downloads' link shows up
|
