Plot
? |
Symb
? |
Source
* |
Average ? |
Thresholds ? |
N_
data |
QC1
parameter |
Data
downloads |
Remarks |
| method |
value |
unit |
method |
value |
| 1 |
• | QC1DB |
none |
|
none |
none | |
151 |
resol3 |
this |
last_yr |
all
|
resolution at blue end |
| 1 |
• | QC1DB |
none |
|
none |
none | |
151 |
resol1 |
this |
last_yr |
all
|
resolution at red end |
| 1 |
• | QC1DB |
MEDIAN |
3.11e+03 |
none |
VAL | 2600,3200 |
151 |
resol2 |
this |
last_yr |
all
|
resolution at centre |
| 2 |
• | QC1DB |
none |
|
none |
none | |
151 |
resol3 |
this |
last_yr |
all
|
resolution at blue end |
| 2 |
• | QC1DB |
none |
|
none |
none | |
151 |
resol1 |
this |
last_yr |
all
|
resolution at red end |
| 2 |
• | QC1DB |
MEDIAN |
2.99e+03 |
none |
VAL | 2600,3200 |
151 |
resol2 |
this |
last_yr |
all
|
resolution at centre |
| 3 |
• | QC1DB |
none |
|
none |
none | |
151 |
resol3 |
this |
last_yr |
all
|
resolution at blue end |
| 3 |
• | QC1DB |
none |
|
none |
none | |
151 |
resol1 |
this |
last_yr |
all
|
resolution at red end |
| 3 |
• | QC1DB |
MEDIAN |
2.95e+03 |
none |
VAL | 2600,3200 |
151 |
resol2 |
this |
last_yr |
all
|
resolution at centre |
| 4 |
• | QC1DB |
none |
|
none |
none | |
151 |
resol3 |
this |
last_yr |
all
|
resolution at blue end |
| 4 |
• | QC1DB |
none |
|
none |
none | |
151 |
resol1 |
this |
last_yr |
all
|
resolution at red end |
| 4 |
• | QC1DB |
MEDIAN |
2.97e+03 |
none |
VAL | 2600,3200 |
151 |
resol2 |
this |
last_yr |
all
|
resolution at centre |
| |
|
*Data sources: QC1DB: QC1 database; LOCAL: local data source
|
Plot 1
scores: not implemented
| | data source: | vimos_ifu_score
(QC1 database) |
dataset:
(numbers below apply to this dataset) | resol3 | • |
| average: | none |
| thresholds: | none |
| N_data plotted: | 151 |
| [click plot for closeup] |
Plot 2
scores: not implemented
| | data source: | vimos_ifu_score
(QC1 database) |
dataset:
(numbers below apply to this dataset) | resol3 | • |
| average: | none |
| thresholds: | none |
| N_data plotted: | 151 |
| [click plot for closeup] |
Plot 3
scores: not implemented
| | data source: | vimos_ifu_score
(QC1 database) |
dataset:
(numbers below apply to this dataset) | resol3 | • |
| average: | none |
| thresholds: | none |
| N_data plotted: | 151 |
| [click plot for closeup] |
Plot 4
scores: not implemented
| | data source: | vimos_ifu_score
(QC1 database) |
dataset:
(numbers below apply to this dataset) | resol3 | • |
| average: | none |
| thresholds: | none |
| N_data plotted: | 151 |
| [click plot for closeup] |
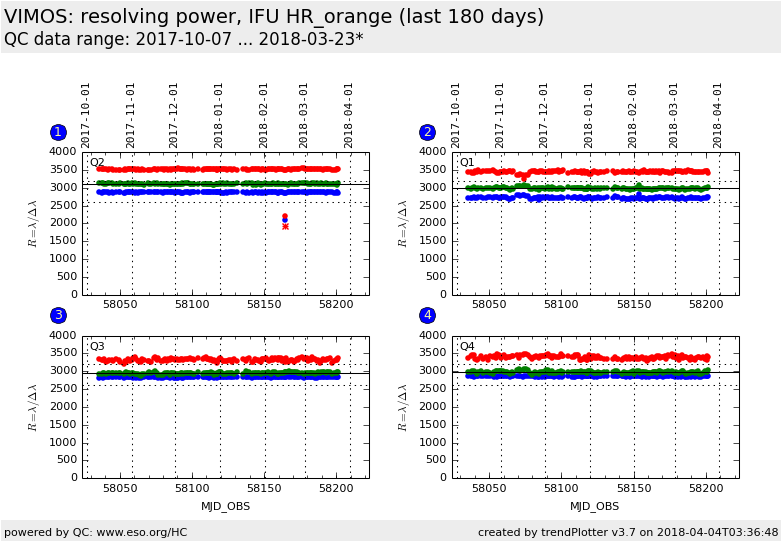
Trending plot for resolution (resolving power R) derived from IFU arc lamp
measurements.
Resolution is measured at the blue and the red end, and at the centre of the
spectral range. The "cent" plots only show the latter; they include
scoring.
The "full" plots also show the results at the blue and red ends;
these are not scored.
Template ID: ifu_cal_DayCalib (daytime Health Checks), ifu_cal_NightCalib
(attached night-time). Pipeline recipe: vmifucalib.
General information
Click on any of the plots to see a close-up version.
The latest date is indicated on top of the plot.
If configured,
- data points belonging to the latest date are specially marked
- statistical averages are indicated by a solid line, and thresholds by broken lines
- outliers are marked by a red asterisk. They are defined as data points outside the
threshold lines
- "aliens" (= data points outside the plot Y limits) are marked by a red arrow (↑ or ↓)
- you can download the data for each parameter set if the 'Data downloads' link shows up
|
