Plot
? |
Symb
? |
Source
* |
OPS?
** |
Average ? |
Thresholds ? |
N_
data |
QC1
parameter |
Data
downloads |
Remarks |
| method |
value |
unit |
method |
value |
| 1 |
• | QC1DB |
no |
none |
|
arcsec |
none | |
30 |
image_quality |
this |
last_yr |
all
|
image quality vs. expected IQ, ellipticity <= 0.23 |
| 1 |
• | QC1DB |
no |
none |
|
arcsec |
none | |
41 |
image_quality |
this |
last_yr |
all
|
image quality vs. expected IQ, ellipticity > 0.23 |
| 2 |
• | QC1DB |
no |
none |
|
arcsec |
none | |
244 |
image_quality |
this |
last_yr |
all
|
image quality vs. expected IQ, ellipticity <= 0.23 |
| 2 |
• | QC1DB |
no |
none |
|
arcsec |
none | |
261 |
image_quality |
this |
last_yr |
all
|
image quality vs. expected IQ, ellipticity > 0.23 |
| 3 |
• | QC1DB |
no |
none |
|
arcsec |
none | |
118 |
image_quality |
this |
last_yr |
all
|
image quality vs. expected IQ, ellipticity <= 0.23 |
| 3 |
• | QC1DB |
no |
none |
|
arcsec |
none | |
33 |
image_quality |
this |
last_yr |
all
|
image quality vs. expected IQ, ellipticity > 0.23 |
| 4 |
• | QC1DB |
no |
none |
|
arcsec |
none | |
340 |
image_quality |
this |
last_yr |
all
|
image quality vs. expected IQ, ellipticity <= 0.23 |
| 4 |
• | QC1DB |
no |
none |
|
arcsec |
none | |
332 |
image_quality |
this |
last_yr |
all
|
image quality vs. expected IQ, ellipticity > 0.23 |
| 5 |
• | QC1DB |
no |
none |
|
arcsec |
none | |
82 |
image_quality |
this |
last_yr |
all
|
image quality vs. expected IQ, ellipticity <= 0.23 |
| 5 |
• | QC1DB |
no |
none |
|
arcsec |
none | |
36 |
image_quality |
this |
last_yr |
all
|
image quality vs. expected IQ, ellipticity > 0.23 |
| |
|
*Data sources: QC1DB: QC1 database; LOCAL: local text file | **OPS: to indicate that OPSLOG data are included
|
Plot 1
scores: not implemented
| | data source: | vimos_sci_img
(QC1 database) |
dataset:
(numbers below apply to this dataset) | image_quality | • |
| average: | none |
| thresholds: | none |
| N_data plotted: | 30 |
| [click on plot for closeup] |
Plot 2
scores: not implemented
| | data source: | vimos_sci_img
(QC1 database) |
dataset:
(numbers below apply to this dataset) | image_quality | • |
| average: | none |
| thresholds: | none |
| N_data plotted: | 244 |
| [click on plot for closeup] |
Plot 3
scores: not implemented
| | data source: | vimos_sci_img
(QC1 database) |
dataset:
(numbers below apply to this dataset) | image_quality | • |
| average: | none |
| thresholds: | none |
| N_data plotted: | 118 |
| [click on plot for closeup] |
Plot 4
scores: not implemented
| | data source: | vimos_sci_img
(QC1 database) |
dataset:
(numbers below apply to this dataset) | image_quality | • |
| average: | none |
| thresholds: | none |
| N_data plotted: | 340 |
| [click on plot for closeup] |
Plot 5
scores: not implemented
| | data source: | vimos_sci_img
(QC1 database) |
dataset:
(numbers below apply to this dataset) | image_quality | • |
| average: | none |
| thresholds: | none |
| N_data plotted: | 82 |
| [click on plot for closeup] |
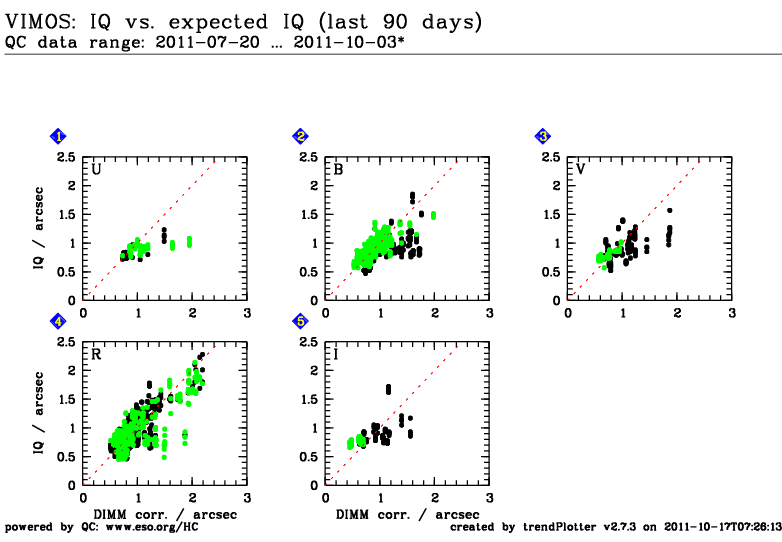
Trending plot for image quality vs. expected image quality (from DIMM).
Template ID: img_obs_Offset. Pipeline recipe: vmimobsstare.
General information
Click on any of the plots to see a close-up version.
The latest date is indicated on top of the plot, data points belonging to that date are specially marked.
If configured,
- statistical averages are indicated by a solid line, and thresholds by broken lines
- outliers are marked by a red asterisk. They are defined as data points outside the
threshold lines
- "aliens" (= data points outside the plot Y limits) are marked by a red arrow (↑ or ↓)
- you can download the data for each parameter set if the 'Data downloads' link shows up
|
