Plot
? |
Symb
? |
Source
* |
Average ? |
Thresholds ? |
N_
data |
QC1
parameter |
Data
downloads |
Remarks |
| method |
value |
unit |
method |
value |
| 1 |
• | QC1DB |
MEDIAN |
29.9 |
ADU |
none | |
27 |
qc_readnoise |
this |
last_yr |
all
|
READNOISE, average over all 16 detectors |
| 2 |
• | QC1DB |
MEDIAN |
28.5 |
ADU |
none | |
432 |
qc_readnoise |
this |
last_yr |
all
|
READNOISE, values of all detetcors |
| 3 |
• | QC1DB |
MEDIAN |
4.63 |
ADU |
none | |
27 |
qc_readnoise |
this |
last_yr |
all
|
READNOISE, stdev over all detectors |
| 4 |
■ | LOCAL |
none |
|
ADU |
none | |
396 |
qc_readnoise |
n/a |
Score per Detector: Green = within the thresholds |
| 4 |
■ | LOCAL |
none |
|
ADU |
none | |
36 |
qc_readnoise |
n/a |
Score per Detector: Red = beyond thresholds |
| 4 |
. | LOCAL |
none |
|
ADU |
none | |
396 |
qc_readnoise |
n/a |
Score per Detector: Green = within the thresholds |
| 4 |
. | LOCAL |
none |
|
ADU |
none | |
36 |
qc_readnoise |
n/a |
Score per Detector: Red = beyond thresholds |
| |
|
*Data sources: QC1DB: QC1 database; LOCAL: local data source
|
Plot 1
scores: not implemented
| | data source: | vircam_gain
(QC1 database) |
| dataset: | qc_readnoise | • |
| median: | 29.9 | ADU |
| thresholds: | none | |
| N_data plotted: | 27 |
| [click on plot for closeup] |
Plot 2
scores: not implemented
| | data source: | vircam_gain
(QC1 database) |
| dataset: | qc_readnoise | • |
| median: | 28.5 | ADU |
| thresholds: | none | |
| N_data plotted: | 432 |
| [click on plot for closeup] |
Plot 3
scores: not implemented
| | data source: | vircam_gain
(QC1 database) |
| dataset: | qc_readnoise | • |
| median: | 4.63 | ADU |
| thresholds: | none | |
| N_data plotted: | 27 |
| [click on plot for closeup] |
Plot 4
scores: not implemented
| | data source: | local data source
|
dataset:
(numbers below apply to this dataset) | qc_readnoise | ■ |
| average: | none |
| thresholds: | none |
| N_data plotted: | 396 |
| [click on plot for closeup] |
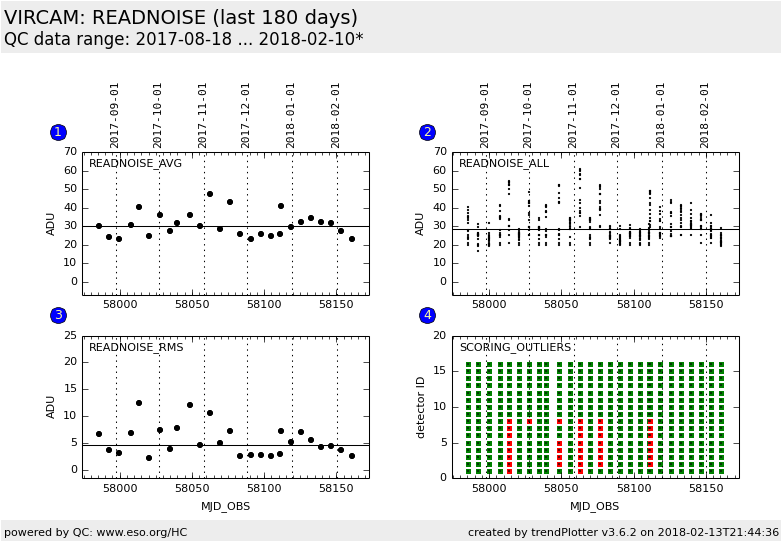
Trending plot for detector read noise.
QC parameters are derived from the gain data set, which consists of two flats
and two dark frames.
Name:
Fits header: QC.READNOISE,
QC1 DB: qc_readnoise
Description:
read noise in electrons, obtained from the two consecutive dark frames of the
gain template
High READNOISE values are not only indicators for larger statistical noise, but also for differences between the two dark frames,
caused, e.g. by the variable horizontal stripe pattern.
Setup:
DET.DIT = 5sec, DET.NDIT = 1, INS.FILT1.NAME = Y (of the flats)
These plots describe:
Fig. 1. Average view: The QC parameter averaged over all detectors.
This view is sensitive to common changes.
Fig. 2. Resolved View: The QC parameter resolved for all detectors.
Fig. 3. Scatter View: The standard deviation of the QC parameter, obtained from the sample of all detectors.
This view is sensitive changes of individual detectors.
Fig. 4. Scoring View: Scoring values of all 16 QC parameters.
Green = within the acceptance thresholds.
Red = beyond the acceptance thresholds.
Find more information on the VIRCAM GAIN tutorial page.
General information
Click on any of the plots to see a close-up version.
The latest date is indicated on top of the plot.
If configured,
- data points belonging to the latest date are specially marked
- statistical averages are indicated by a solid line, and thresholds by broken lines
- outliers are marked by a red asterisk. They are defined as data points outside the
threshold lines
- "aliens" (= data points outside the plot Y limits) are marked by a red arrow (↑ or ↓)
- you can download the data for each parameter set if the 'Data downloads' link shows up
|
