Plot
? |
Symb
? |
Source
* |
Average ? |
Thresholds ? |
N_
data |
QC1
parameter |
Data
downloads |
Remarks |
| method |
value |
unit |
method |
value |
| 1 |
• | QC1DB |
none |
|
arcsec |
none | |
130 |
gauss_fwhm_max |
this |
last_yr |
all
|
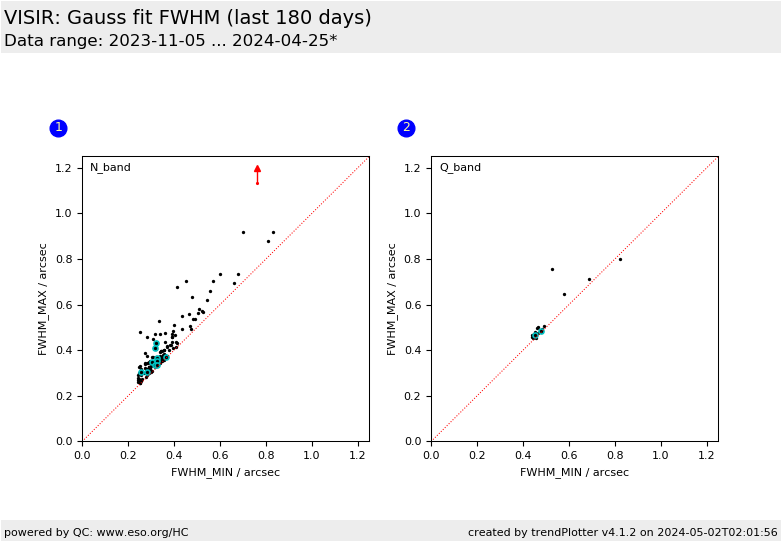
FWHM in N band, maximum vs. minimum |
| 2 |
• | QC1DB |
none |
|
arcsec |
none | |
18 |
gauss_fwhm_max |
this |
last_yr |
all
|
FWHM in Q band, maximum vs. minimum |
| |
|
*Data sources: QC1DB: QC1 database; LOCAL: local data source
|
Plot 1
scores: not implemented
| | data source: | visir_zp_img
(QC1 database) |
| dataset: | gauss_fwhm_max | • |
| average: | none |
| thresholds: | none |
| N_data plotted: | 130 |
| [click plot for closeup] |
Plot 2
scores: not implemented
| | data source: | visir_zp_img
(QC1 database) |
| dataset: | gauss_fwhm_max | • |
| average: | none |
| thresholds: | none |
| N_data plotted: | 18 |
| [click plot for closeup] |
Measurements of the image quality from imaging standard star observations.
These plots show values that are determined from a 2D Gaussian fit to the star
image. Plotted are the maximum and the minimum FWHM of the flux in this fit.
Pipeline values are in pixels which have been converted to arcsecs using the
pixel field-of-view of 0.0453 arcsec/px.
General information
Click on any of the plots to see a close-up version.
The latest date is indicated on top of the plot.
If configured,
- data points belonging to the latest date are specially marked
- statistical averages are indicated by a solid line, and thresholds by broken lines
- outliers are marked by a red asterisk. They are defined as data points outside the
threshold lines
- "aliens" (= data points outside the plot Y limits) are marked by a red arrow (↑ or ↓)
- you can download the data for each parameter set if the 'Data downloads' link shows up
|
