|
[page auto-refreshes after 300 sec]
[stop
| on]
[press Ctrl+Shift+R to enforce refresh of scores, dates and news]
|
|||||||||||||||||||||||||||||||||||||||||||||||||||||||||||||||||||||||||||||||||||||||||||||||||||||||||||||
|
|||||||||||||||||||||||||||||||||||||||||||||||||||||||||||||||||||||||||||||||||||||||||||||||||||||||||||||
|
|||||||||||||||||||||||||||||||||||||||||||||||||||||||||||||||||||||||||||||||||||||||||||||||||||||||||||||
|
|||||||||||||||||||||||||||||||||||||||||||||||||||||||||||||||||||||||||||||||||||||||||||||||||||||||||||||
|
|||||||||||||||||||||||||||||||||||||||||||||||||||||||||||||||||||||||||||||||||||||||||||||||||||||||||||||

|
|||||||||||||||||||||||||||||||||||||||||||||||||||||||||||||||||||||||||||||||||||||||||||||||||||||||||||||
|
|||||||||||||||||||||||||||||||||||||||||||||||||||||||||||||||||||||||||||||||||||||||||||||||||||||||||||||
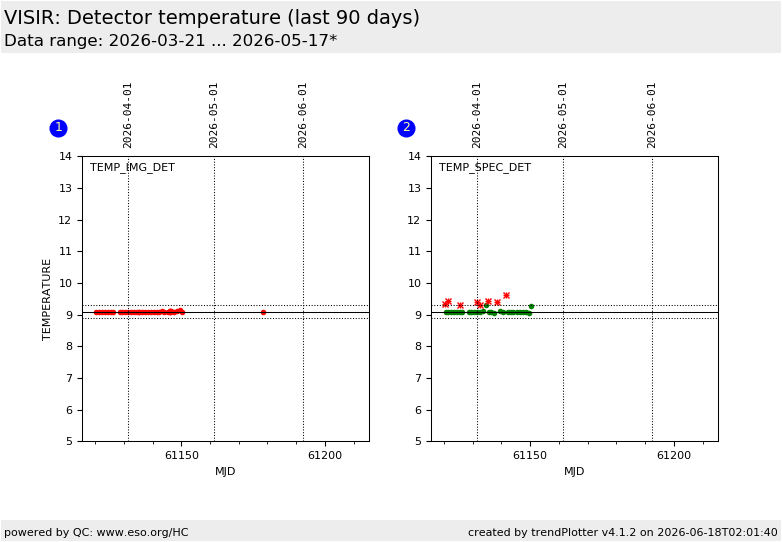
This is a trending plot monitoring temperatures of the VISIR imaging and spectroscopic detectors. As of May 12, 2010 the temperature of the imaging detector is read from keyword INS_TEMP30_VAL and of the spectroscopic detector from keyword INS_TEMP31_VAL. Before that date different keywords were used - INS_SENS30_VAL and INS_SENS31_VAL respectively. General information Click on any of the plots to see a close-up version. The latest date is indicated on top of the plot. If configured,
|
|||||||||||||||||||||||||||||||||||||||||||||||||||||||||||||||||||||||||||||||||||||||||||||||||||||||||||||