| Europhysics
News (2001) Vol. 32 No. 4
A cosmological surprise: the universe accelerates Bruno Leibundgut and Jesper Sollerman
Cosmology is in turmoil. The standard model of a few years ago has recently been abandoned and replaced by new ideas. The reasons for this dramatic change are new measurements of the geometry and the matter contents of the universe. The new model implies a dynamical age of the universe that accommodates the oldest known stellar objects, but raises the need for a dark energy component, which is not readily explained within the current particle physics theories. Most current cosmological models are based on the Big Bang theory, in which the universe started in a hot and dense state. Since then, the cosmic expansion has led to adiabatic cooling, and the subsequent condensations of the matter have formed stars, galaxies and clusters of galaxies. The Big Bang theory predicts not only the universal expansion, but also the baryonic matter content and a relic radiation from the original hot phase. All of these predictions have been observed. The detection of the cosmic microwave radiation and the tiny temperature fluctuations in it are often cited as the most spectacular success of this theory (e.g. Peebles 2001). An extension to the Big Bang theory is the proposed inflationary phase at the very earliest times of the expansion. The inflation would be driven by energy, which emerges from the decay of a particle field and produces a universe many times larger than a simple linear expansion. Inflation predicts the seeds for the growth of large-scale structure in the universe. Since the universe would be inflated several orders of magnitudes, it would essentially have a flat space geometry (Guth 1997). Among the open questions in this picture are the matter/energy content of this universe and its future. The average energy density determines the fate of a homogeneous and isotropic universe governed by gravitational forces. It was thought that the matter content governs the expansion of the universe today, while at early phases radiation dominated. In this simple picture the geometry of the universe is directly coupled to the matter density. A flat universe implies an equivalent matter density of about 8.10-27 kg m-3, the critical density. For an average density below this value, the universe would be open and expand forever, while at a higher density it would be closed and eventually re-collapse. Just a few years ago the total energy content of the universe was unknown. All indications were that baryonic matter makes up only about 5% of the critical density (Bahcall et al. 1999). To explain the kinematics of galaxies and clusters of galaxies an additional mass component often referred to as ?missing? or ?dark? mass had to be introduced. The search for direct evidence for the dark matter has, despite substantial efforts, been futile so far. Nevertheless, from observations of the evolution and mass determinations of clusters of galaxies, it appears that dark and baryonic matter could explain about 30% of the critical density. Should the universe be flat, as required if inflation is correct, then some other energy component must contribute to the average density. For a cosmologist, there are only few parameters needed
to describe the universe. All models are based on Einstein?s theory of
general relativity. The world models are characterized by two parameters:
the current rate and the deceleration of the expansion. The first parameter
is called the Hubble constant after Edwin Hubble, who discovered the cosmic
expansion in 1929. The other parameter describes the change of the expansion
and depends on the energy density and the curvature of the universe. The
contributions to the density are expressed as fractions of the critical
density and are denoted by the Greek letter W,
e.g. WM, for the matter density.
The expansion itself is typically measured by the redshift. This is the
ratio of the scale factor at two different times of the expansion and observed
as a shift of spectral features to longer wavelengths. Hubble?s law states
that for small distances the redshift is proportional to the distance.
At large look-back times and distances the linearity of Hubble?s law breaks down and the distances depend on the energy density of the universe. The various constituents, typically matter and radiation are considered, contribute in different ways to the energy density. Radiation ceased to be gravitationally important at a redshift of about z=1000, a time from which we can only measure the cosmic microwave background radiation. Another component is the famous cosmological constant introduced by Albert Einstein to reconcile the solutions of his equations with a static universe. He later abandoned this term, when Edwin Hubble discovered the general expansion of the universe. For many decades the cosmological constant was not considered in the world models as there was no obvious reason to include it and as it was not possible to connect it to any particle theory. In modern terms, it represents the contribution of the vacuum energy (Carroll et al. 1992). The last three years have seen truly exciting progress in observational cosmology. The flat geometry of the universe has been confirmed by balloon-borne experiments that measured the fluctuations in the cosmic microwave background. The physical scale of these fluctuations can be determined from first principles and the measurement of their angular extend on the sky gives a direct indication of the geometry of the universe. All experiments agree that the universe is most likely flat (de Bernardis et al. 2000, Balbi et al. 2000). A complementary approach to determine the geometry is through the measurement of distances. This approach actually measures the deceleration due to the gravitational attraction, which slows down the cosmic expansion. The amount of deceleration hence directly determines the average density. Cosmological distances are, however, notoriously difficult
to attain. The long and arduous history of the determination of the Hubble
constant painfully reflects this difficulty. Even today, it appears that
the value of the Hubble constant is uncertain to about 10%. The easiest
way to measure distances is through standard candles, i.e. objects with
identical absolute luminosity. Many candidates for standard candles have
been proposed. Only few astronomical objects have turned out to be suitable.
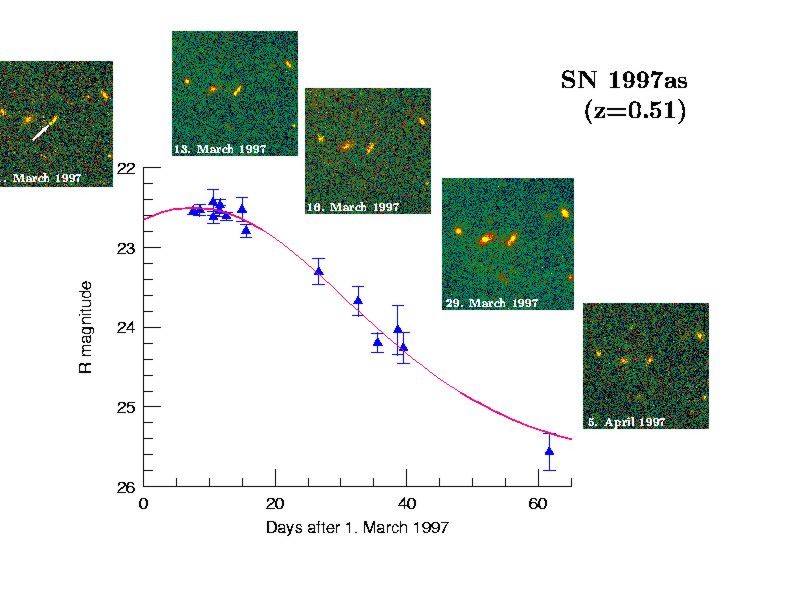
A prime candidate for such a standard candle is a certain type of stellar explosions. Known to astronomers as Type Ia Supernovae these explosions occur at the end stages of stellar evolution, when low-mass stars exhaust their fuel and start to contract and cool down. The resulting white dwarfs are so compact and dense that they are supported by electron pressure. It can be shown that there is an upper limit to the mass supported by the pressure of the degenerate electrons. This Chandrasekhar limit, named after Subrahmanyan Chandrasekhar, is near 1.4 times the mass of the Sun. A single, isolated white dwarf will not change its mass, but a white dwarf in a double star system may acquire mass from its companion. If this process is efficient enough, the white dwarf will turn itself into a thermonuclear bomb that will burn carbon and oxygen explosively to nuclear statistical equilibrium. For the density and pressure in these explosions this is mostly a radioactive nickel isotope (56Ni), which decays through g-decay to 56Co and further to stable 56Fe. The energy is deposited in the star and blows it apart. Such an explosion can outshine the light of a whole galaxy made up of some 1010 stars (Figure 1). The Chandrasekhar mass is a natural limit and makes it conceivable that all Type Ia Supernovae are similar. Such a uniform constellation assures that there are only small differences between individual explosions, a prime condition for a standard candle. Observing
supernovae
Not all Type Ia Supernovae are identical. However, there is a way to normalise their peak luminosity according to their light curves. More luminous supernovae display a slower temporal evolution. In this way, it is possible to normalise all objects to the same peak luminosity and make them exquisite standard candles. One way to empirically test the quality of a standard candle
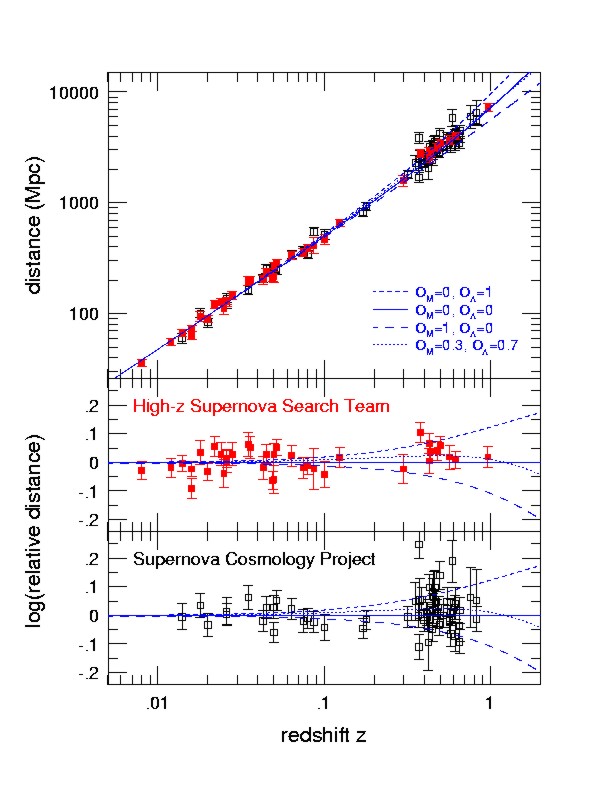
is to look at the distance vs. redshift diagram (Figure 2). For a redshift
below z=0.1 the scatter around the line of linear expansion is extremely
small and proves that, at least in the nearby universe, the supernovae
can be used as distance indicators. Direct determination of the absolute
luminosity of Type Ia Supernovae has recently been obtained for the 10
nearest supernovae which exploded within the last 60 years. The peak luminosity
of these objects is indeed very uniform.
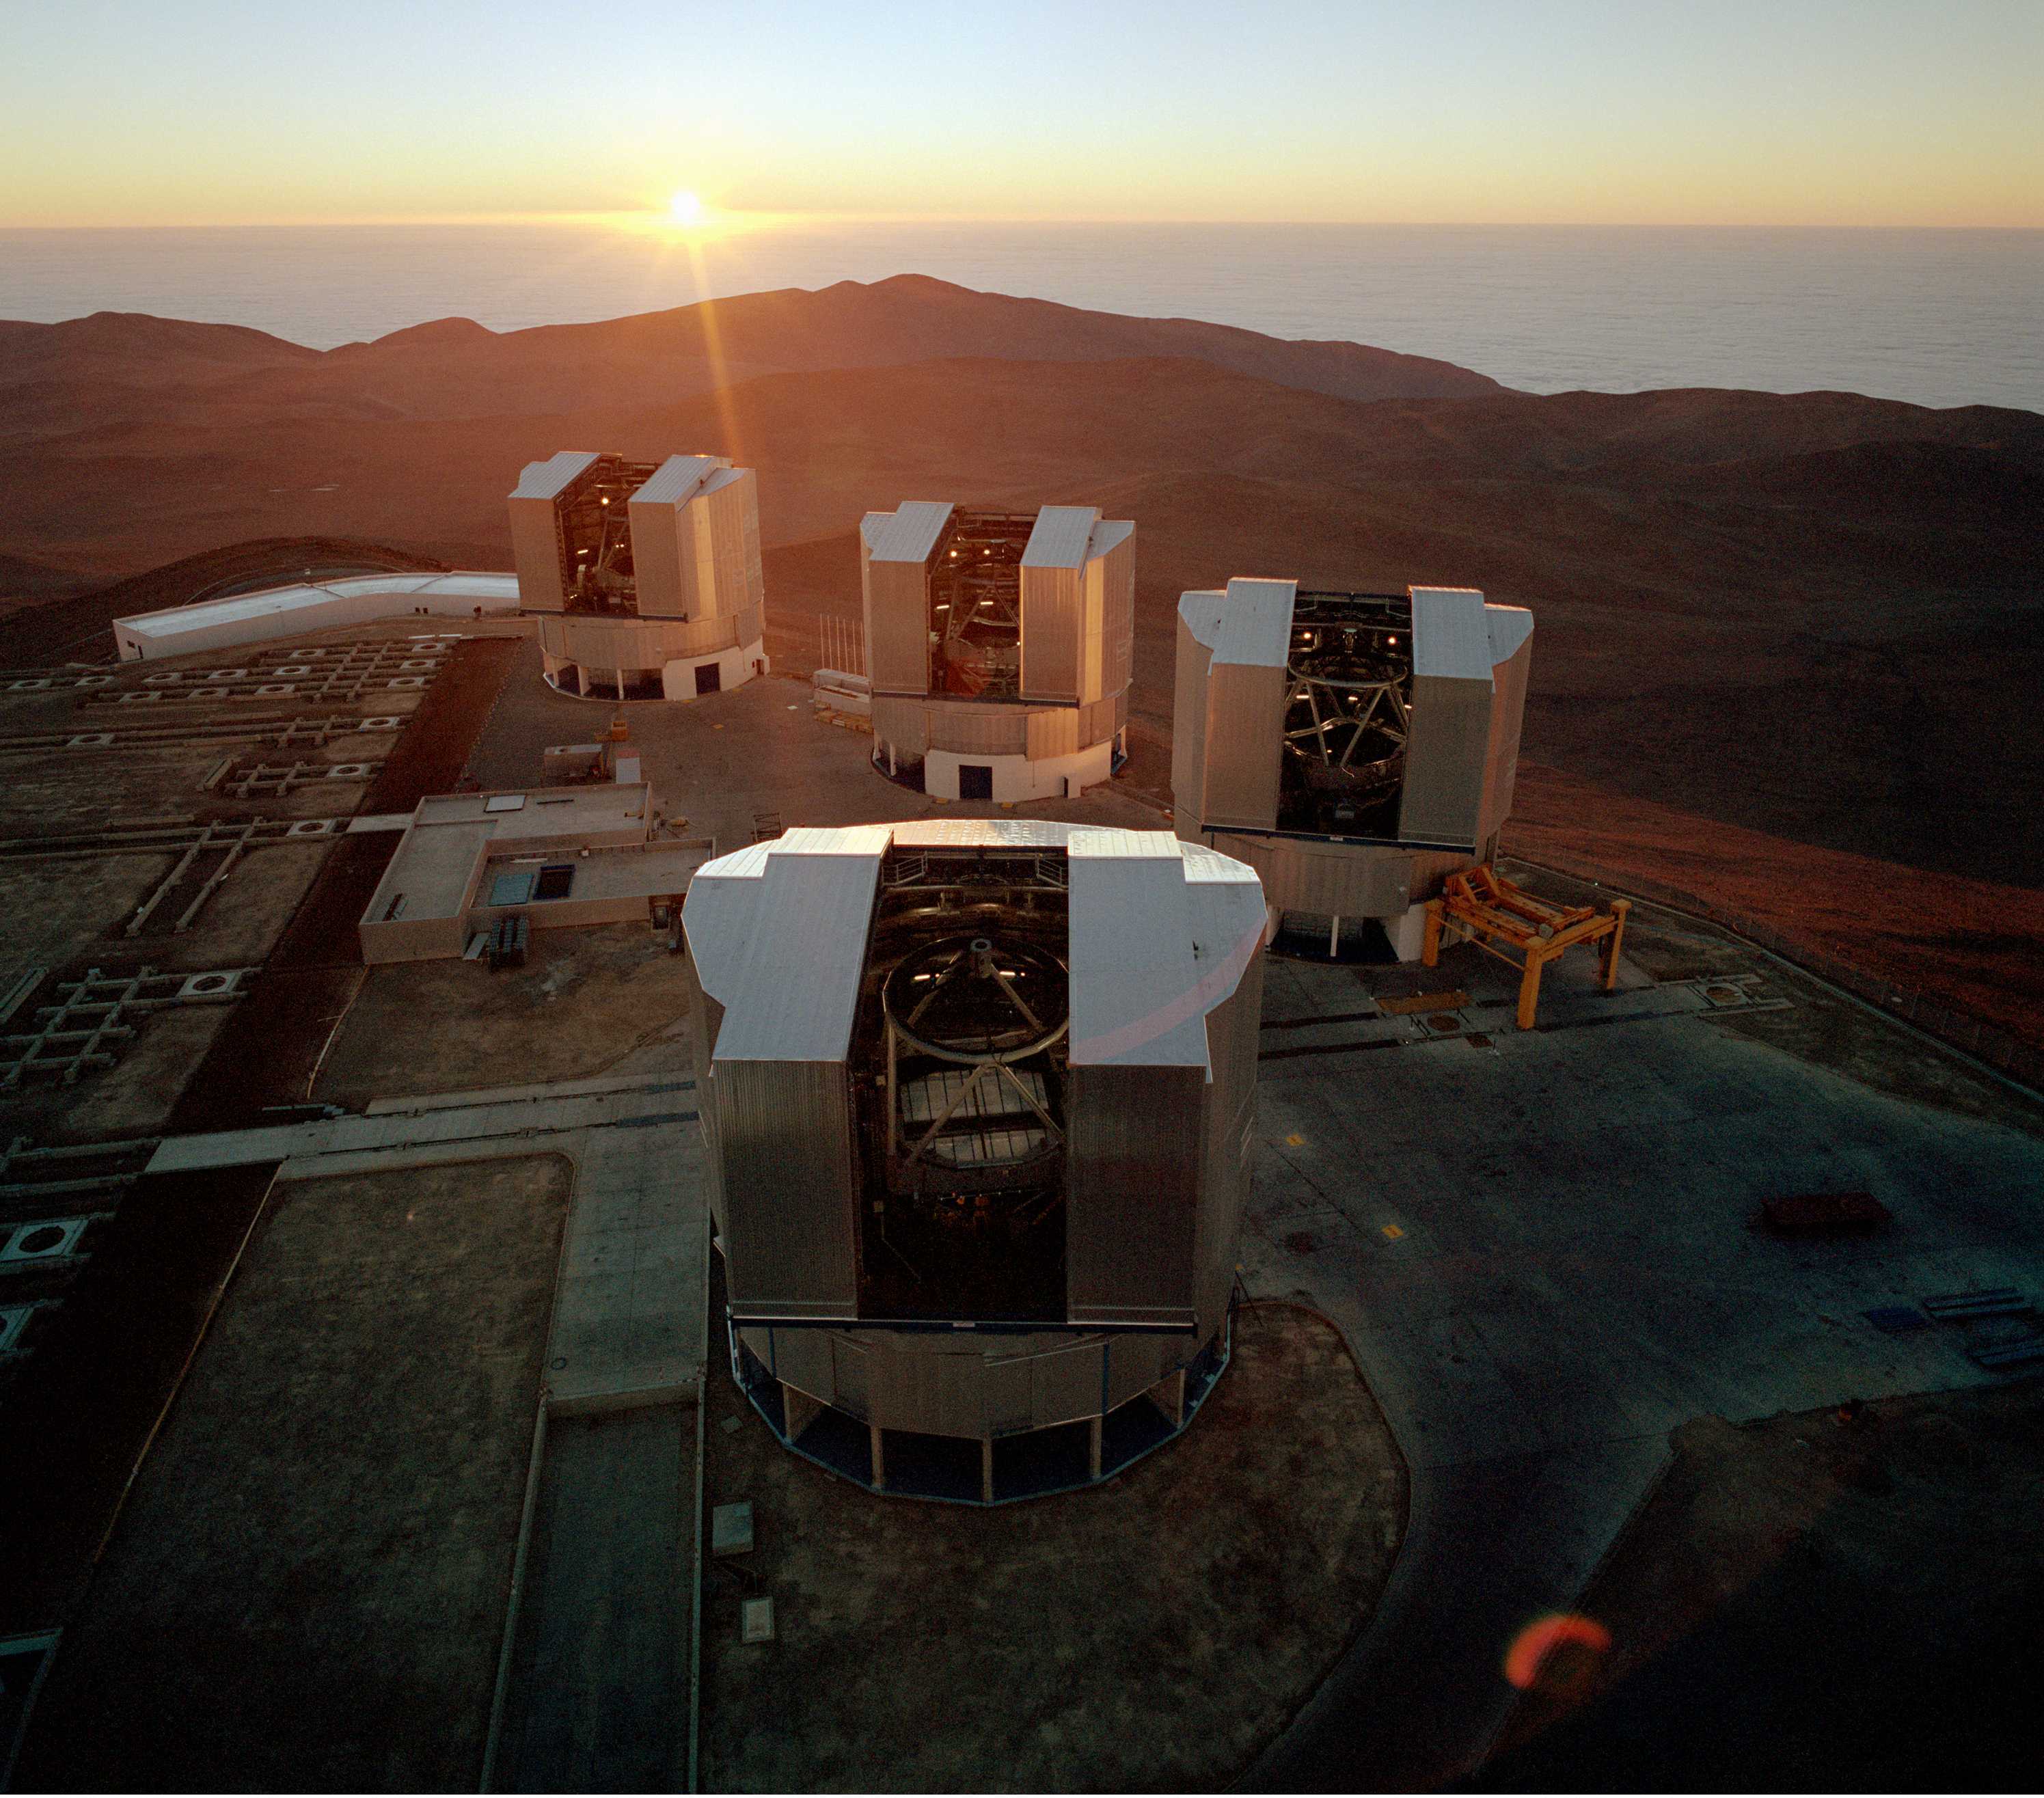
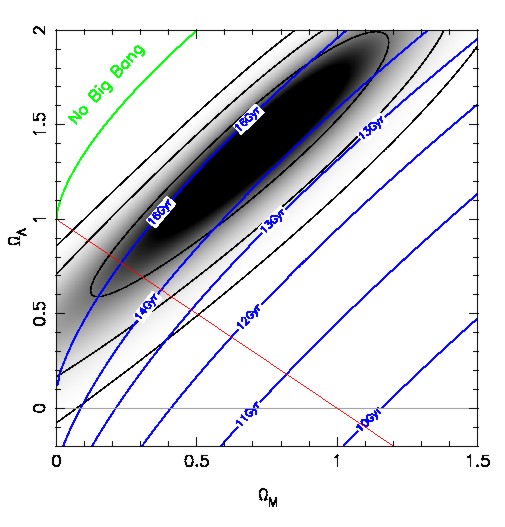
Distant supernovae, like the example in Figure 1, are more difficult to observe. Since supernovae are such rare events a large volume has to be surveyed to discover a sufficient number for co-ordinated follow-up observations. It was soon recognised that such a project would exceed the possibilities of a single observatory or group of astronomers. In fact, this experiment makes use of all the largest telescopes available. A typical campaign involves the European Southern Observatory VLT (Figure 3), the Keck telescopes, the Canada- France-Hawaii telescope, the Cerro Tololo Inter-American Observatory and the Hubble Space Telescope. The supernovae are observed for about two months with all available telescopes. The resulting light curves, like the one shown in Figure 1, are analysed to derive the peak brightness and plot them in diagrams like Figure 2. With the model lines calibrated by the nearby supernovae the distant explosions tell us how much the universe has expanded between then and now. From Figure 2 it is obvious that the distances are larger than what would be expected in a freely coasting, i.e. empty, universe. Even worse would be a fit for a flat and matter-filled Einstein-de Sitter model. The distant supernovae are simply too faint, i.e. too distant to be compatible with the old paradigm of a universe filled with matter and radiation only. There has to be a component to the energy density that has accelerated the expansion over the last ~6.109 years (Riess et al. 1998, Perlmutter et al. 1999, Hogan et al. 1999, Riess 2000). An obvious candidate is the cosmological constant. With the supernova result it appears that it should be re-introduced to explain the data. Another possibility is that the cosmological constant is indeed zero, but that there is a particle field that through its decay acts like a cosmological constant. It has now come to be known as ?quintessence? (Ostriker and Steinhardt 2001). Independent of which explanation is correct we can designate the energy density of this ?dark energy?? as WL. Figure 4 shows the probability distribution between the matter density WM and WL as the supernova distances define them. It is obvious that models with WL=0 are excluded at the >95% level for all models with a positive matter content. This comes from the fact that an accelerating, negative-pressure component is required, which can not be achieved with matter or radiation. A nice feature of world models with these parameters would
be that the dynamical age of the universe is no longer in conflict with
the ages of the oldest stars in our Milky Way. We have marked the isochrones
of the dynamical age for the combination of WM
and WL in Figure 4.
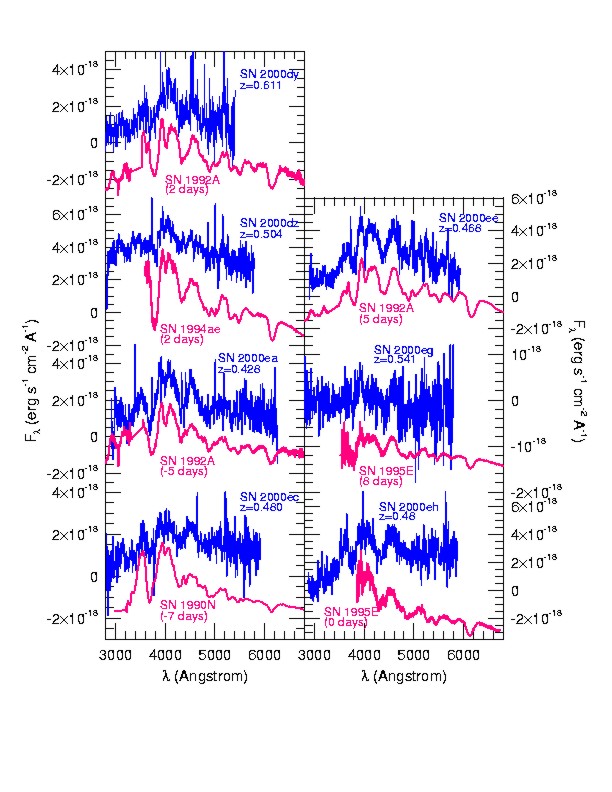
The result from the distant supernovae that the expansion of the universe is not decelerating but in fact accelerates is certainly surprising. We should answer the obvious question how secure this result is. There are a few other possible explanations for the faintness of the distant supernovae. They are an intrinsic evolution of the peak brightness of the supernovae, unrecognised dust, or gravitational lensing. Evolution has been the downfall of all previously proposed distance indicators. Take for example regular galaxies. Looking back for several 109 years means that a galaxy is composed of stars, which are on average younger than the ones currently in our Milky Way. Since a galaxy with young stars has a larger fraction of short-lived, massive stars, which are brighter and bluer, it will change its luminosity over time. Could Type Ia Supernovae also suffer from evolutionary effects? At first glance, such an evolution is less likely. According to the current models they are explosions of stars, which always end up in the same configuration, a white dwarf at the Chandrasekhar limit. However, even though the bomb always has the same mass, its composition may vary slightly. The explosive carbon burning in a white dwarf depends on the mixture of carbon and oxygen. One could imagine that the distant supernovae have had a different chemical composition at the explosion than their nearby counterparts. Also, stellar evolution predicts that younger white dwarfs are the descendants from predominantly more massive stars. Thus, the parent population of the distant supernovae could be different from the one observed nearby. Unlike for the nearby supernovae we can not use the linear expansion law to check for consistency. What has been tried in the last few years is to make sure that the distant objects have the same appearance as the nearby ones. This program is still under way, but first results are already becoming available. The observed spectra of the two populations are so far indistinguishable (Figure 5). There is further a very characteristic light curve shape with a second maximum of Type Ia Supernovae in the near-infrared, which by now has also been observed for the distant supernovae. On the other hand, there appears to be a trend to bluer colours for distant supernovae, which, if confirmed, may hint at evolution. Interstellar dust also dims astronomical objects. Galactic dust distributed in the plane of the Milky Way is the reason we can not observe the Galactic Centre in optical light. But galactic dust not only dims the objects, it also preferably scatters blue light and makes objects appear redder. If the intrinsic colour of an object is know, the observed light can be corrected according to the galactic absorption law. The colour evolution of Type Ia Supernovae is in fact very uniform and by always obtaining colour information for the distant supernovae we can check for dust and correct the brightness, if necessary. But there is nothing that says that the galactic dust is representative throughout the universe. For example, larger dust particles scatter differently so that the supernovae still would be dimmed but not as reddened. Observing programs to check this possibility have been carried out last year and are currently being analysed. Along the light path of any distant object lie other massive objects. Background galaxies are distorted by the potential wells through which light has to travel and the galaxies are stretched into large arcs, which are regularly observed in massive clusters of galaxies. Another effect of gravitational lensing is amplification or de- amplification of the light. It turns out that distant objects are on average de-amplified, i.e. statistically appear fainter. This would be an obvious explanation of the dimness of the distant supernovae. However, the effect is not large enough, even if all mass would be concentrated in compact objects, and can not explain the distant supernovae. This result is based on model calculations, as this is the only effect that can not be observed with the supernova light itself. There is one signature, which would almost unambiguously prove that the universe has been accelerating over about half its age. This is the deceleration during the early phases of the expansion. The cosmological constant does not change over time, but since the density decreases the gravitational action should have been much larger during the first few 109 years. In Figure 2 this shows up as a non-monotonic evolution. The critical redshift range is around z=1.2, a range that has so far not been explored by the observations. This is stretching the current capabilities of any existing telescope. The supernovae become exceedingly faint and due to the redshift have to be observed at near-infrared wavelengths where the night sky is much brighter than in the optical. Nevertheless, the next observing campaigns will target exactly this redshift range to test whether the acceleration of the universal expansion is indeed the correct interpretation for the dimness of the distant supernovae. There is a big problem with the cosmological constant. In modern particle theories it is associated with the energy of the vacuum, but these theories also predict a value for the vacuum energy which deviates by more than 50 orders of magnitudes from the cosmological observations. Although this has been a problem all along, the supernova measurements have acerbated this problem, by requiring a non-zero but small (<1) cosmological constant. For these reasons many theorists currently favour quintessence models. But this requires introducing a new particle field and corresponding potentials, which have to be fine-tuned to have an action like the observed one. But there is more on the horizon. To distinguish between a cosmological constant and quintessence the time variability of the acceleration should be checked. Tracing the supernova distances in detail can do this. A large sample of supernovae out to a redshift of about z=1.5 is needed. Proposals to obtain such samples have already been made. Type Ia Supernovae together with the recent results on the cosmic microwave background and the masses of clusters of galaxies are consistent with a flat universe, in which about 30% is gravitating matter and 70% is contributed by ?dark energy? (cosmological constant or quintessence). Only about 5% of the total energy stem from baryonic matter. Another 5% may be contributed by massive neutrinos. The opinions of cosmologists currently range from visions of ?precision cosmology? to worries about the fact that we have to add new constituents to the universe for which we have currently no explanation at all. This is not necessarily a contradiction. Observers have been furnished with tools over the last decade, which allow them to probe many of the cosmological questions in much more detail and with much higher precision. On the other hand, these new results have shown that our picture of the universe was incomplete and will need further scrutiny References: Bahcall, N., Ostriker, J., Perlmutter, S., and Steinhardt, P. 1999, Science, 284, 1481 Balbi, A., et al. 2000, Astrophysical Journal Letters, 545, 1 Carroll, S., Press, W., and Turner, E., 1992, Annual Review of Astronomy and Astrophysics, 30, 499 de Bernardis, et al., 2000, Nature, 404, 955 Guth, A.1997, The inflationary universe. The quest for a new of cosmic origins, Reading: Addison-Wesley Hogan, C., Kirshner, R., and Suntzeff, N. 1999, Scientific American, 280, 28 Leibundgut, B. 2000, The Astronomy and Astrophysics Review, 10, 179 Ostriker, J. and Steinhardt, P.. 2001, Scientific American, 284, 36 Peebles, J. 2001, Scientific American, 284, 44 Perlmutter, S., et al. 1999, Astrophysical Journal, 517, 565 Riess, A. 2000, Publications of the Astronomical Society of the Pacific, 112, 1284 Riess, A., et al. 1998, Astronomical Journal, 116, 1009
Copyright EPS and EDP Sciences, 2001 |
||||||||||||||||||||||