Stability of kappa matrix
Plots by Armin Gabasch using a new recipe he wrote for gasgano.
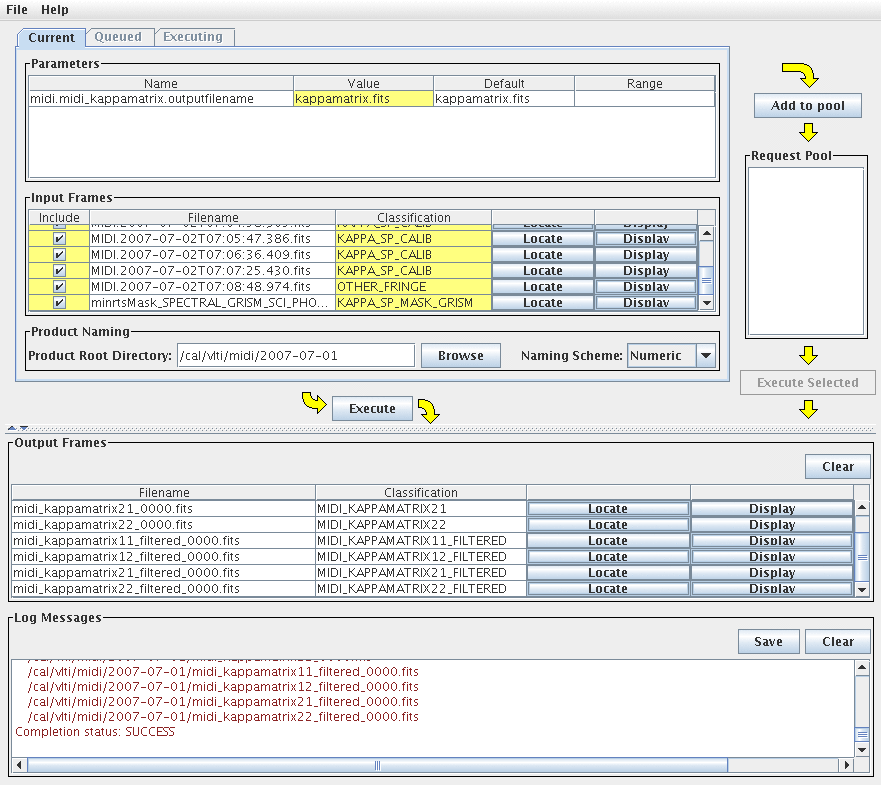
This is a screen shot of the new recipe.
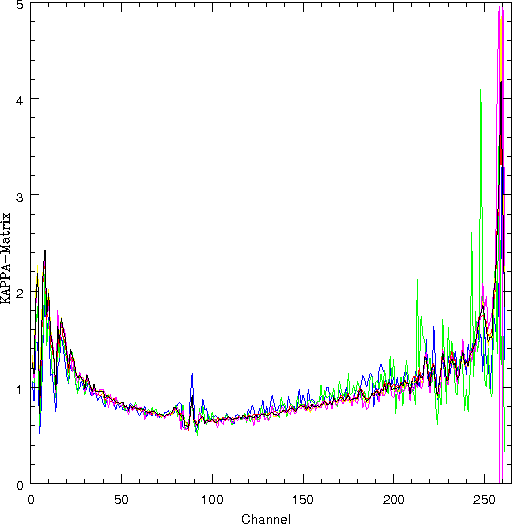
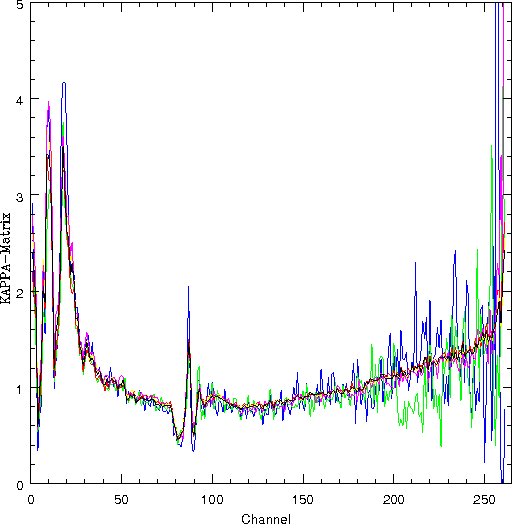
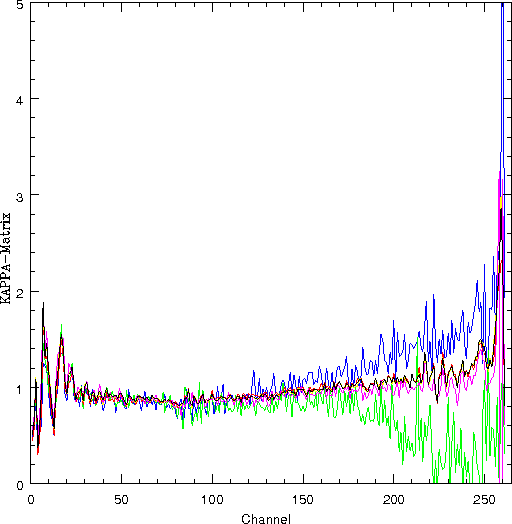
The four plots show the four kappa matrix coefficients, each colored curve corresponding to one file.
The black curves are the averages for each coefficient.
The coefficients (all four in one plot) averaged over all files.

The following 2 sets of plots show 3D rendering of the four kappa matrix coefficients as a function of time.
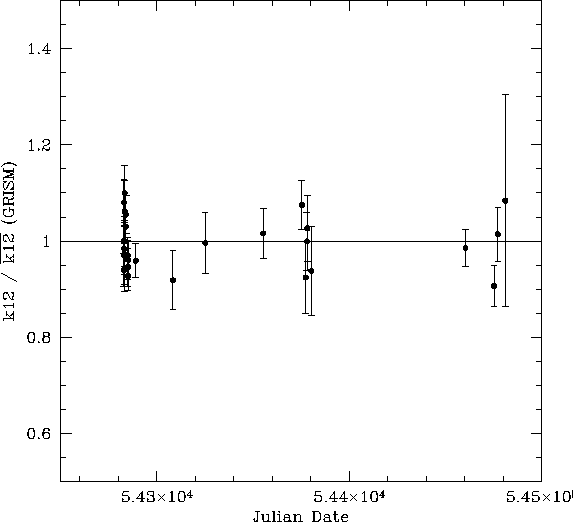
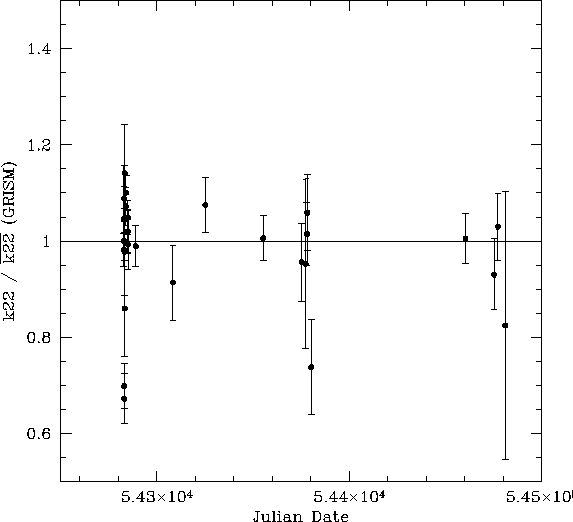
Here we plot measurements of the matrix coefficients based on individual OBs, divided by the mean over all OBs.
The error bars are based on the RMS scatter in the channel interval considered, 130 to 170.
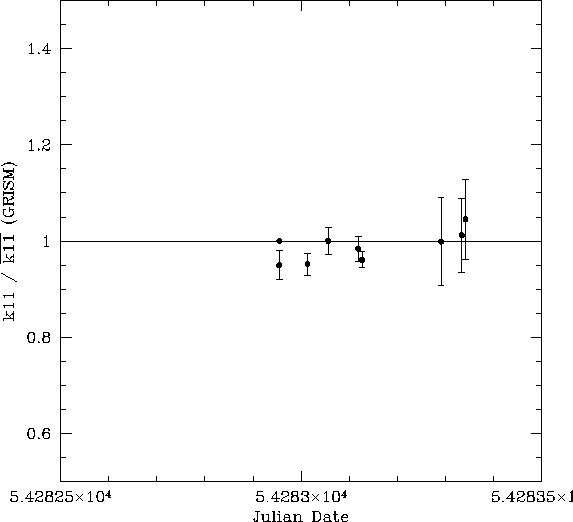
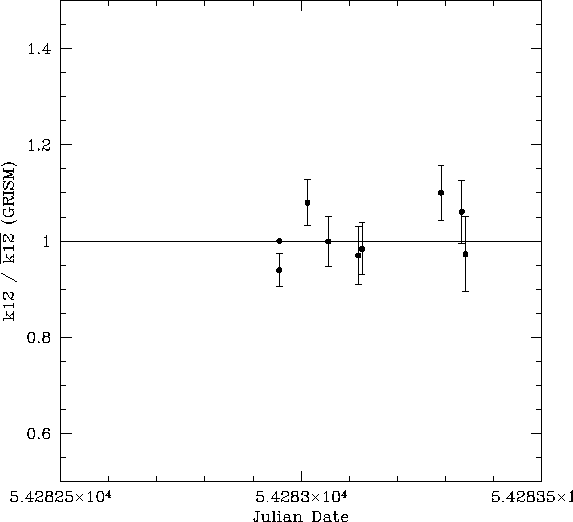
These four plots are the same as above, but just expanded for a single night.
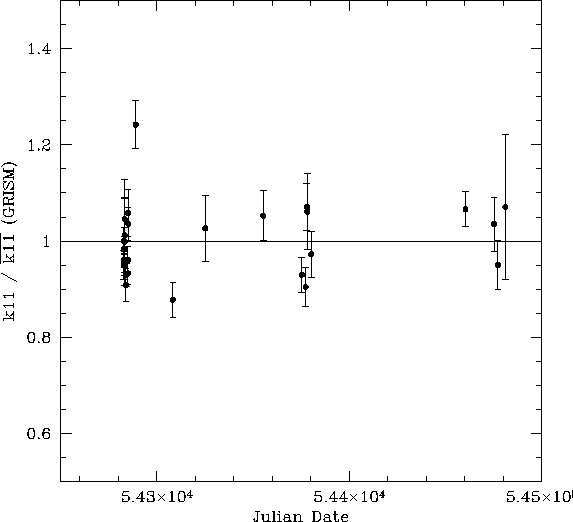
Here we compare GRISM and PRISM results. Each plot contains four coefficients, computed both using a mask for extraction, and without a mask (unchopped).