The field reported below was retrieved from the archive. It was observed using 4 HWP angles, taking 5 exposures per HWP position, 15 minutes each, so that the equivalent exposure time on the Ordinary and Extraordinary beams is 75 minutes per HWP angle. Observations were carried out in dark time. The data were processed using bias and sky flats (no HWP, no Wollaston) taken within one day from the science observations. Sky flats were used directly on the observed frames, therefore leading to a non perfect correction (pixel to pixel variation are removed, but large scale gradients are not exactly taken into account). The redundancy achieved using N=4 HWP positions (instead of the minimum N=2) should however remove this effect, at least with some approximation.
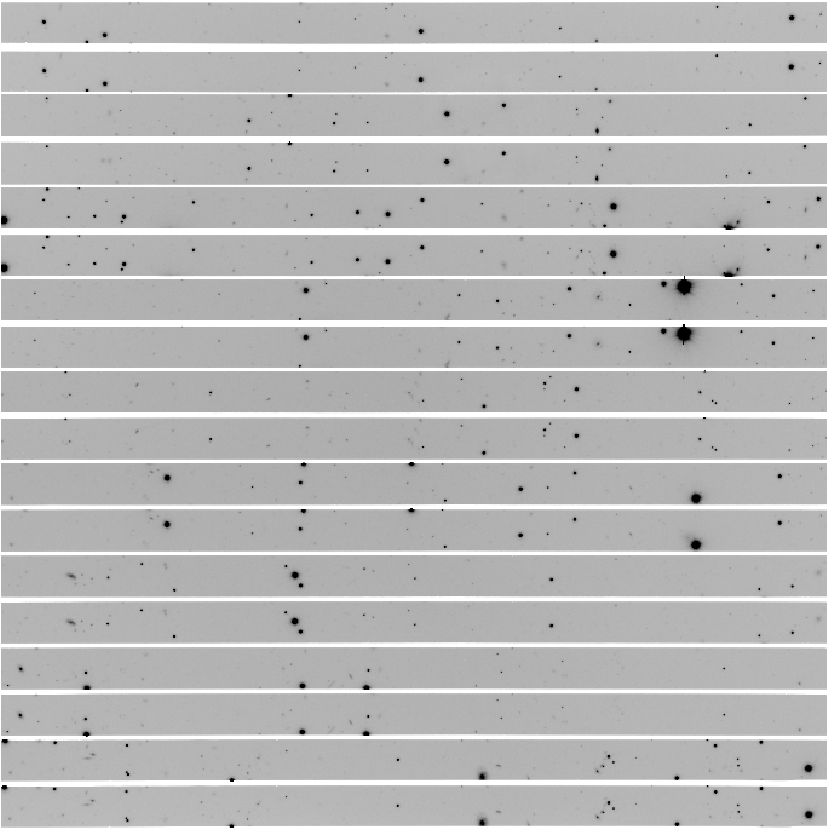
Go with the mouse on the picture to see an example of reduced intensity image (f_o+f_e) for one of the HWP angles.
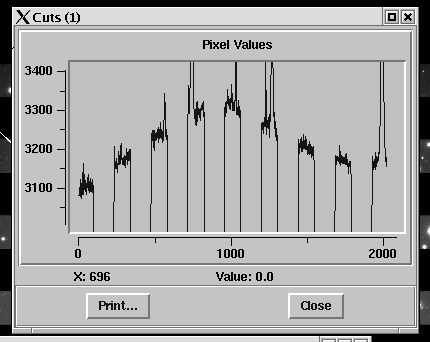
The light concentration is of the order of 3% (peak-to-peak), as one can easily see in a diagonal cross-cut:
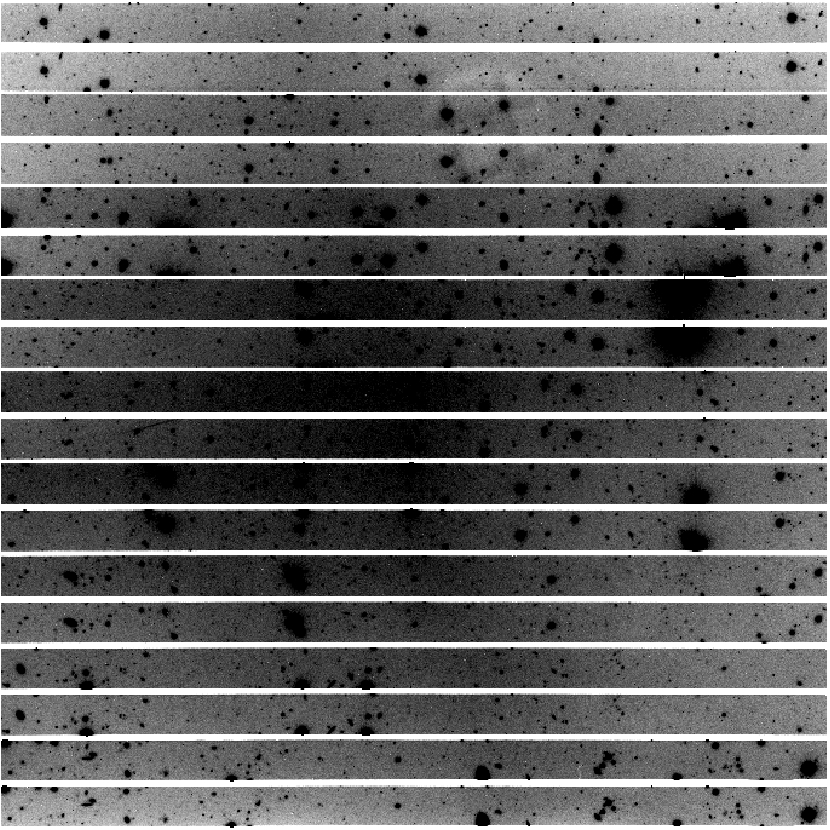
The second is the presence of at least one reflection
which looks like carrying the imprints of the HWP mosaic. This is probably
caused be the saturated star in the right upper corner of the image.
The fact that it is not split in two parts (as the sky image is), suggests
that the reflection takes place after the Wollaston Prism.
A close inspection to the images taken at different angles shows that the
reflex does rotate but it does not move significantly (see also the last
figure in this page).
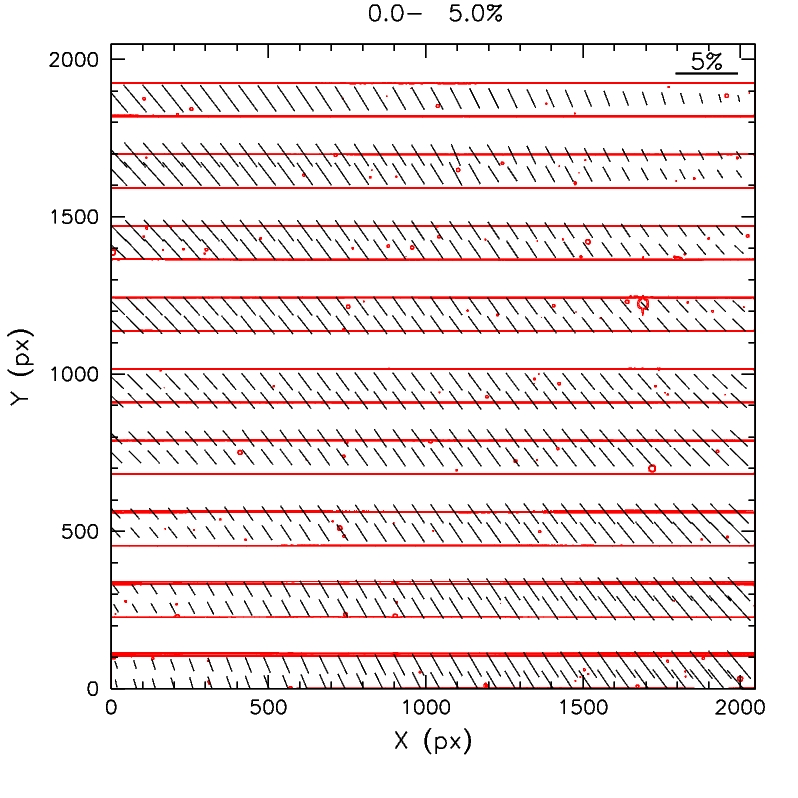
The polarization map one obtains if she does not subtract the sky
background is reported in the following picture, which was obtained binning
U and Q images with 30x30 boxes. The corresponding signal to noise in the
single ordinary and extraordinary images becomes about 6750 per resolution
element at the sky level.
This implies a polarization signal-to-noise ratio (SNR) of about 68 for a
1% polarization.
This SNR is sufficient to make negligible any polarization bias
effect, and the errors on polarization degree and polarization angle
become very low. For this reason, one is confident that all features
seen in the following picture are real.
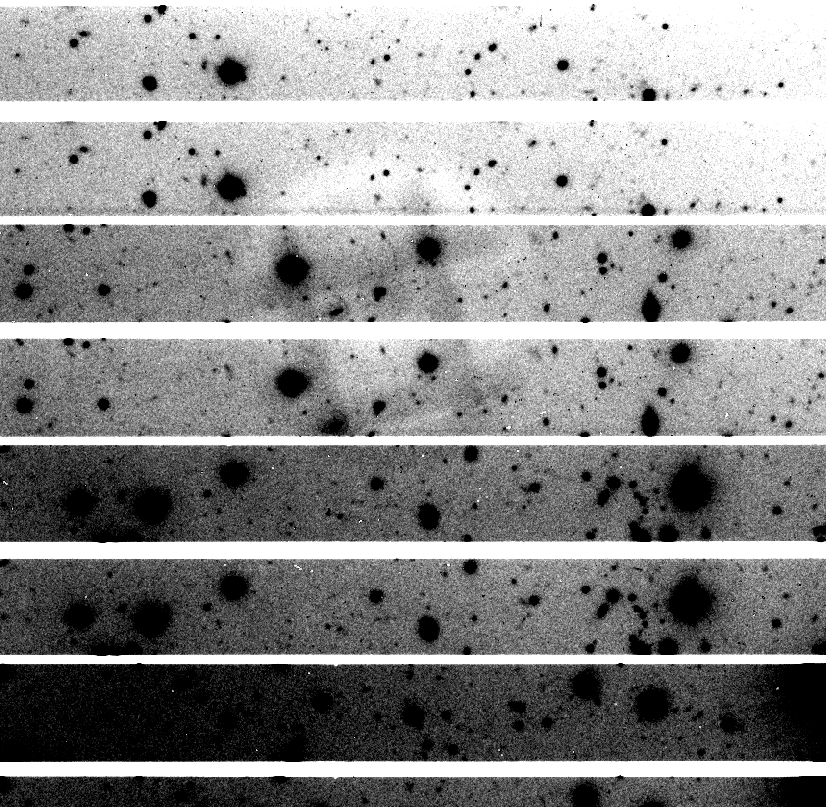
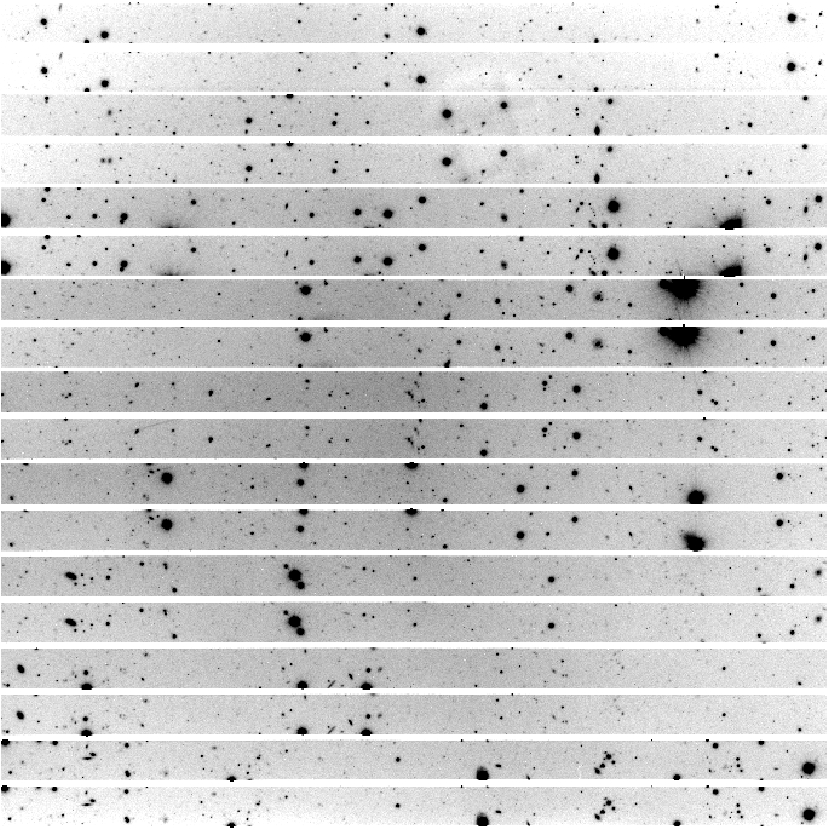
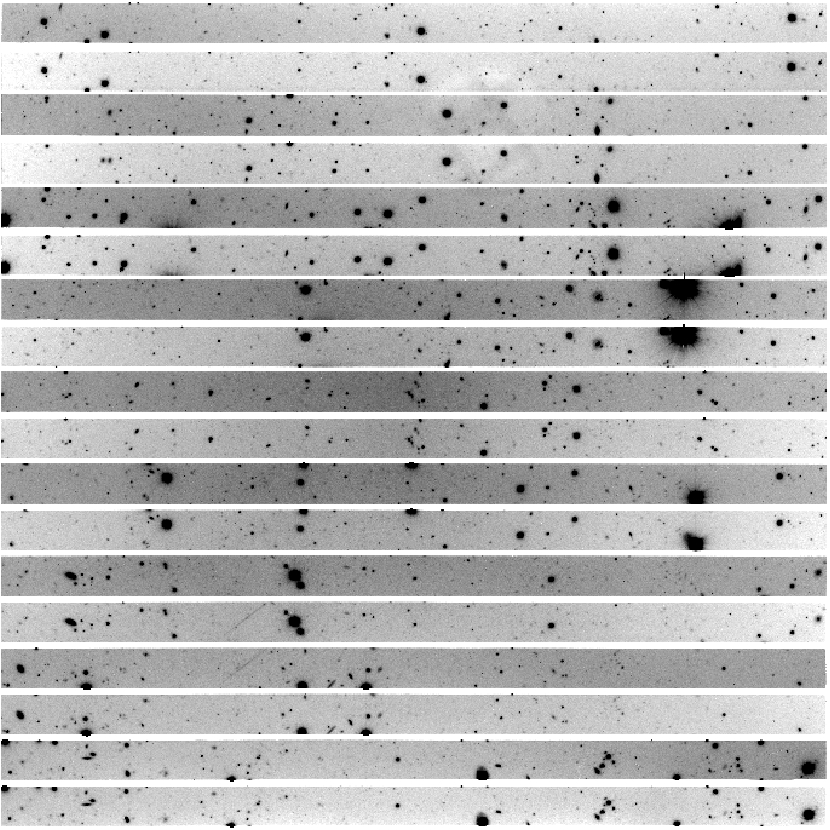
To show that the effect is real and not due to reduction artifacts, in the following picture we present the observed images (bias and flat-field corrected with sky flats) for 0 (upper left), 22.5 (upper right), 45 (lower left) and 67.5 (lower right). All images are displayed with the same intensity cuts and were divided by the same sky flat.
 |  |
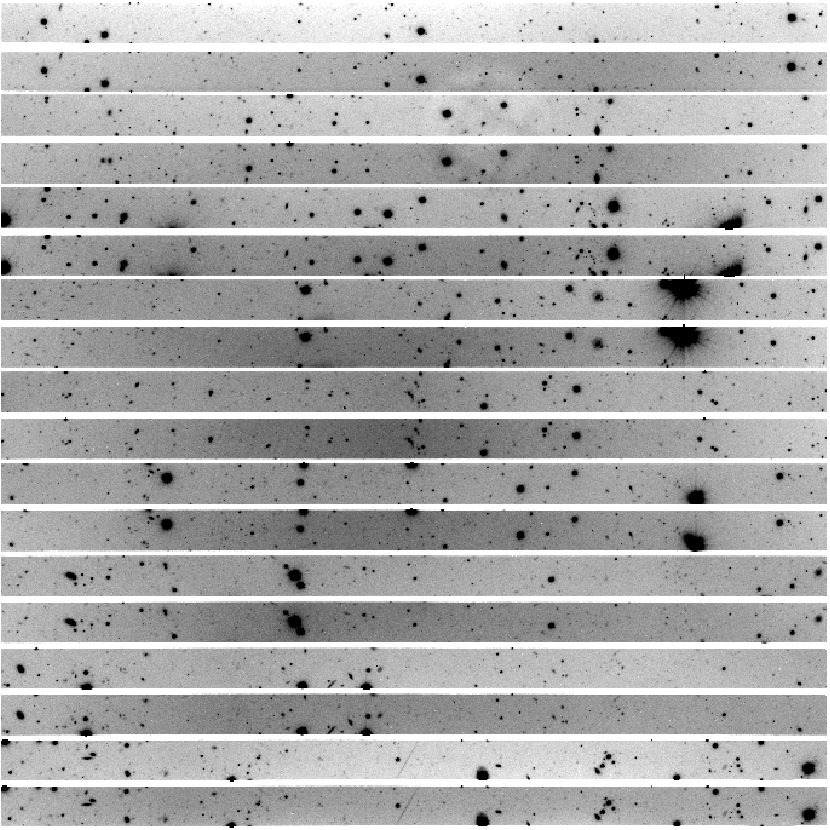 | 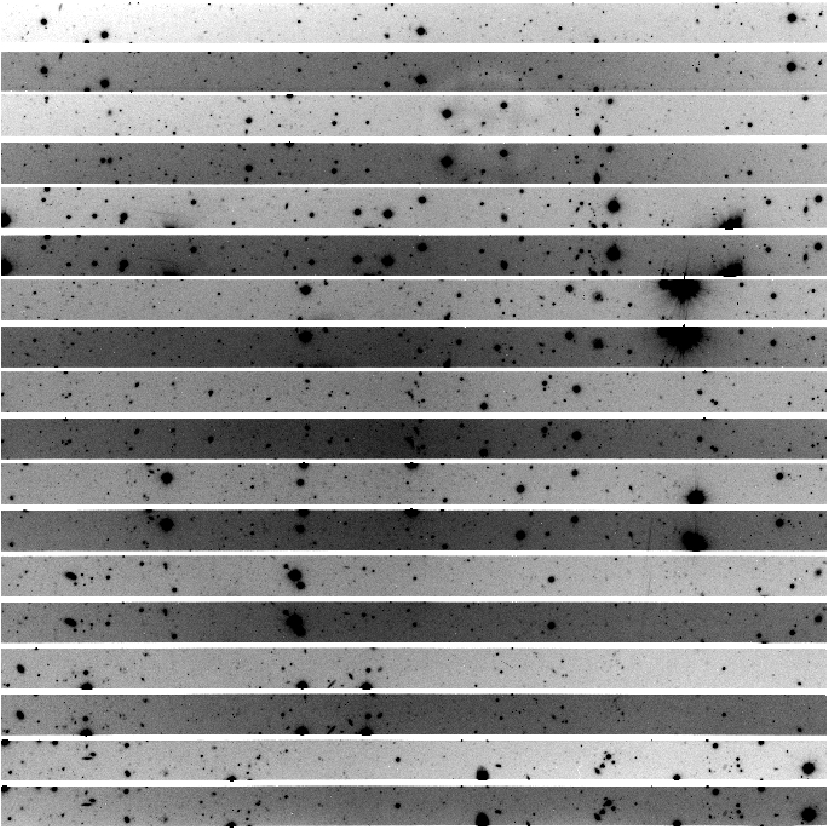 |
As one can see, there are clear polarization patterns. See, for example, the gradients in the upper slitlets of right images (22.5 and 67.5). Background polarization is clearly visible in the 67.5 image, where the difference between ordinary and extraordinary beam is indeed apparent.
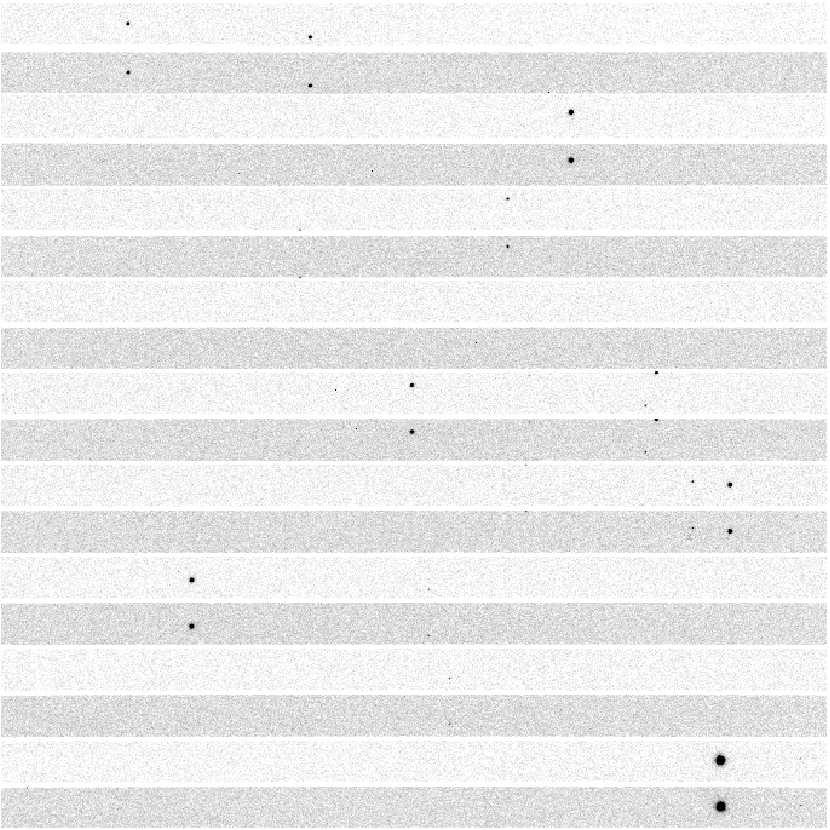 As a further test, we have reduced the data obtained on 2003-12-05, when the
[unpolarized] standard star EG21 was observed using 4 HWP angles. The star
was placed in the lower right corner of the image, in order to detect
any spurious polarization in this region of the field of view.
The data were bias and flat field corrected (using sky flats) with calibrations
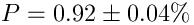
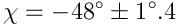
taken within one day. A full reduction has given the following results for the
polarization degree and polarization angle:
As a further test, we have reduced the data obtained on 2003-12-05, when the
[unpolarized] standard star EG21 was observed using 4 HWP angles. The star
was placed in the lower right corner of the image, in order to detect
any spurious polarization in this region of the field of view.
The data were bias and flat field corrected (using sky flats) with calibrations
taken within one day. A full reduction has given the following results for the
polarization degree and polarization angle:
 |
 |