| This documentation is intended both for QC scientists and SciOps astronomers (who may want to ignore the technical information displayed in grey). | ||||||||||||||||||||||||
|
||||||||||||||||||||||||
|
||||||||||||||||||||||||
| bottom plots | contact | ||||||||||||||||||||||||
| NAME | qc_FF_IMG.sh | |||||||||||||||||||||||
| VERSION |
1.0 -- created (2005-03-07) 1.1 -- QC parameters extracted from prod. headers (051107) | |||||||||||||||||||||||
| SYNTAX | SHELL | |||||||||||||||||||||||
| CALL |
processQC from $DFS_PRODUCT/FF_IMG/$DATE: qc_FF_IMG $date $primfile | |||||||||||||||||||||||
| INSTRUMENT | VISIR | |||||||||||||||||||||||
| RAWTYPE | FF_IMG | |||||||||||||||||||||||
| PURPOSE |
extracts QC parameters and records them in the local qclog table $DFO_TREND_DIR/FF_IMG.qclog as well as ingests them in a qc1 database | |||||||||||||||||||||||
| PROCINPUT |
imaging flatfield product | |||||||||||||||||||||||
| QC1TABLE |
trending | table(s) in QC1 database: visir_flat_img | |||||||||||||||||||||||
| TRENDPLOT |
trending | HealthCheck plot(s) associated to this procedure: trend_report_BADPIX_HC.html | |||||||||||||||||||||||
| QC1PAGE |
trending | associated documentation: flat_qc1.html | |||||||||||||||||||||||
| QC1PLOTS top |
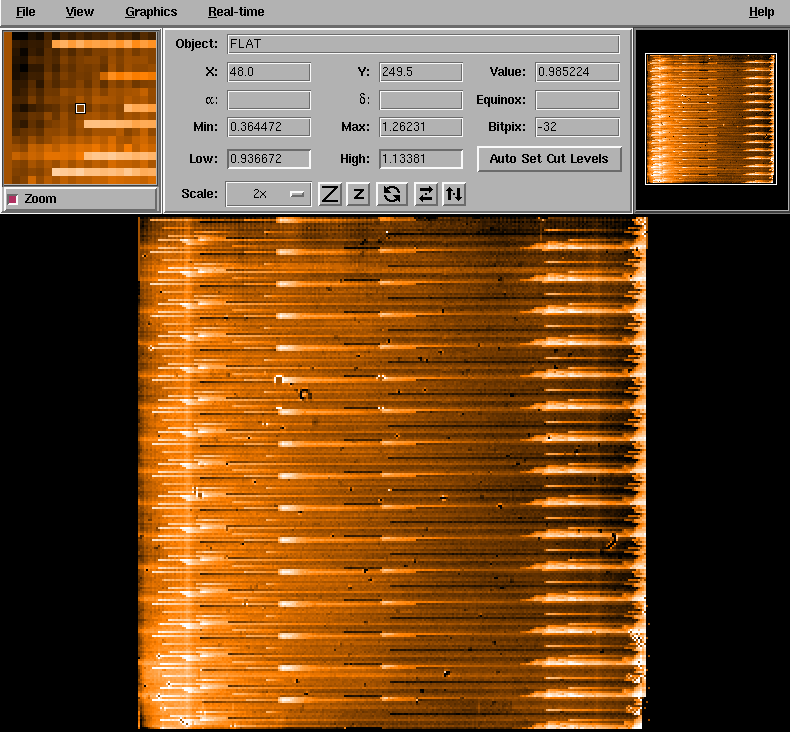
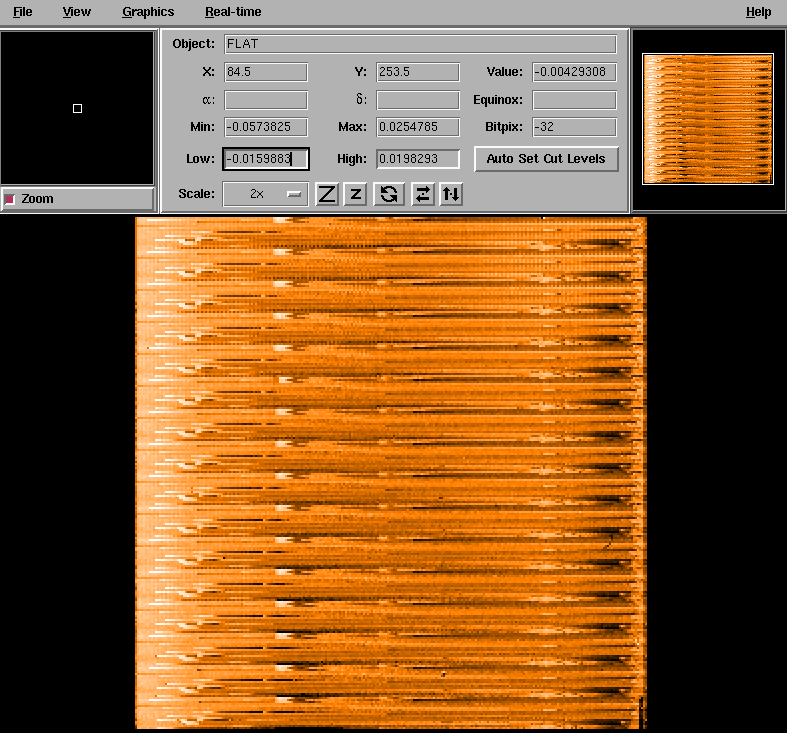
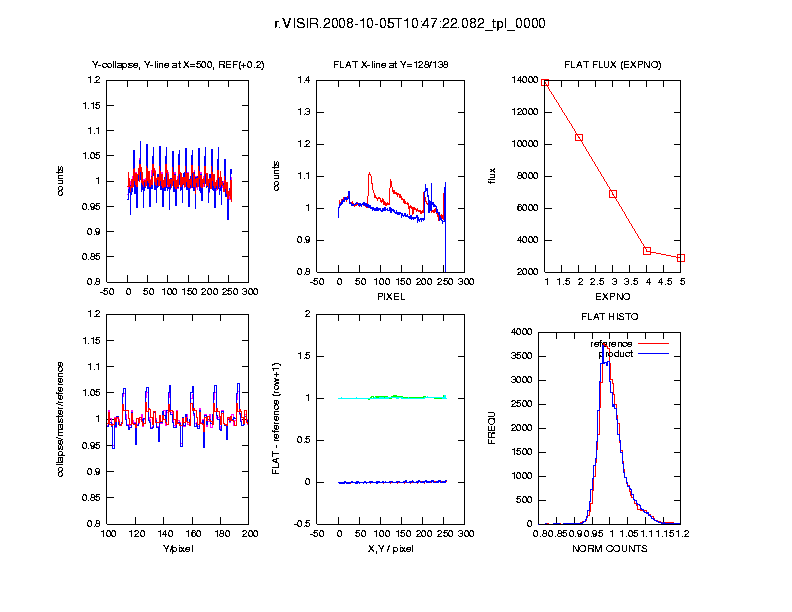
flat1.png the master product is displayed in RTD flat2.png the local difference is displayed in RTD flat3.png the qc plot | |||||||||||||||||||||||
| QC1PARAM |
QC1 parameters written into local QC1 table $DFO_TREND_DIR/FF_IMG.qclog: QC.NBBADPIX FITS key names: INS.PFOV | INS.FILT1.NAME QC1 params created by pipeline: all QC1 params created by this procedure: none | |||||||||||||||||||||||
| ALGORITHM |
Description of algorithms: QC.NBBADPIX: for each pixel gain is calculated (slope of the pixel intensity vs. median); pixels with relative gain: 0.2 < gain < 1.5 are flagged as bad | |||||||||||||||||||||||
| CERTIF |
Reasons for rejection: - NONE; product is not used for data calibration | |||||||||||||||||||||||
| COMMENTS | NONE | |||||||||||||||||||||||
| top | [2012-06-20T10:56:53] created by qcDocu v1.1.2, a tqs tool | |||||||||||||||||||||||