The variance of magnetic field strengths and structures is a
fundamental issue in the structure of the diffuse interstellar
medium. Although Zeeman measurements and infrared polarization provide
a picture of the dense phase, the translucent medium remains
elusive. A survey of approximately 50 lines of sight, using very high
resolution UV and optical spectroscopy (resonance transitions for
velocity and density information) and optical polarization
measurements to decompose the contributors along the lines of sight
has been performed. In the majority of cases, the contributors are
composite and clouds can be separated in velocity and extinction
contributions. A substantial fraction, however, are single clouds
(about 15% of the sample). Unsurprisingly, the polarization is more
randomized with more line-of-sight contributors, but the exceptional
detail also makes this study a warning regarding interpretation of
single-direction measurements of dust properties.
Model
The observed wavelength-dependence of extinction, emission, and the
linear and circular polarisation of light of the diffuse interstellar
medium can be explained by a two component dust model. The model
(Siebenmorgen et al, 2014, A&A 561, A82) is
set up with a small number of parameters: It consists of a mixture of
amorphous carbon and silicate grains with sizes from the molecular
domain of 0.5 up to about 500nm. Dust grains with radii larger than
6nm are spheroids. In the presence of a magnetic field, spheroids may
be partly aligned and polarise light. We find that polarisation
spectra help to determine the upper particle radius of the otherwise
rather unconstrained dust size distribution. Stochastically heated
small grains of graphite, silicates, and polycyclic aromatic
hydrocarbons (PAHs) are included. In this model prolate rather than
oblate grains gives a better fit to observed spectra; the axial ratio
of the spheroids is typically two and aligned silicates are the
dominant contributor to the polarisation .
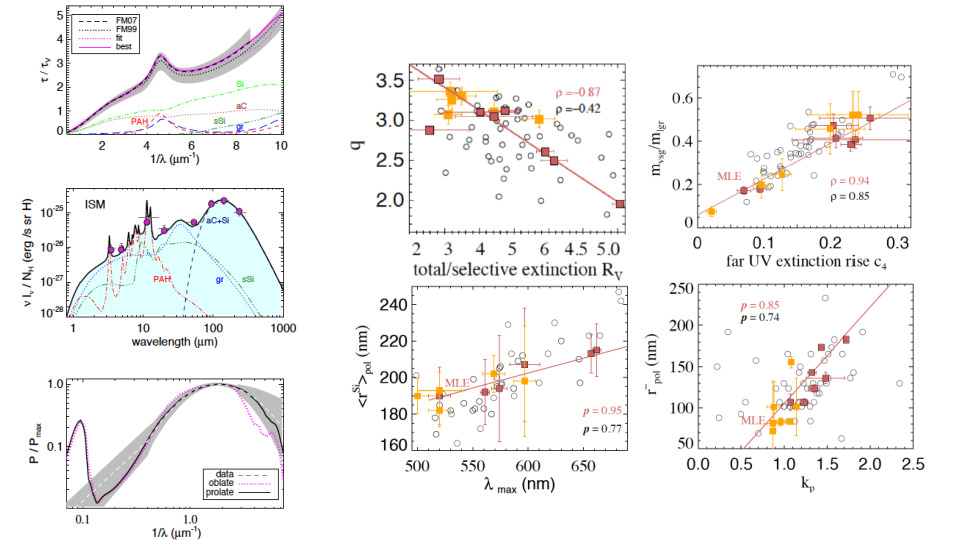
Typical extinction, emission, and polarisation signatures of dust in
the solar neighborhod are shown in the Figure below (right).
Variations of dust properties along distinguished sight-lines towards
stars either including multiple- (open circles) or single aborbing
dust cloud (filled symbols) is shown on the left
(Siebenmorgen et al, 2018, A&A 611, A5). The
number of intersecting clouds is revealed by high resolution
spectroscopy of the Doppler components of interstellar lines (CaII ,
NaI, KI).
Dust in the solar neighbourhood
The above figure shows:
Top-left: The observed extinction curves in the
ISM by Fitzpatrick & Massa (2007), is shown as dashed line and the
1 sigma variation as hatched area. The contribution of the
individual dust components to the total extinction of the model
are given with scaled cross sections.
Middle of left panels:
Emission normalised per H atom when dust is heated by the
ISRF. High Galactic latitudes observations from DIRBE (Arendt et
al. 1998) and FIRAS (Finkbeiner et al. 1999) with 1 sigma error
bars as shown in grey. The model fluxes convolved with the band
passes of the observations are shown as filled circles. The
emission of the individual dust components is given. The total
emission is shown as black line.
Bottom of left panel:
The observed linear polarisation normalised to the maximum
polarisation as given by Voshchinnikov et al. (2012) is shown as
dashed line and 1 sigma variation as hatched area. The normalised
linear polarisation of silicates is shown for prolates as a black
line, and oblates as magenta dotted line.
Top of middle panels:
Dust parameters versus observed extinction and polarisation
characteristics. Influence of the exponent of the dust size
distribution q on the total to selective extinction Rv,
Top of right panels:
The mass ratio of small and large (>6nm) grains, m(vsg) / m(lgr), on
the strength of the far UV rise of the extinction curve c4
Bottom of middle:
The mean size of aligned silicates versus the
wavelength at which the polarisation has its maximum.
Bottom of right panels: The minimum size of aligned silicate grains
versus the width of the polarisation curve.
Symbols:
Sight-lines to individual stars that intersect multiple dust clouds
are shown as open circles and their Pearson correlation coefficient is
given in black. Sight-lines to stars where only a single dust cloud is
penetrated are shown as red squares together with their Person
coefficient and a straight line estimator (MLE) in red. In the course
of the archive research of this proposal we identify a few additional
single-cloud sight-lines that we mark in orange.
Further reading
Siebenmorgen et al, 2018, Large Interstellar Polarisation Survey
II. UV/optical study of cloud-to-cloud variations of dust in the diffuse ISM,
A&A 611, A5
Siebenmorgen et al, 2014, Dust in the diffuse
interstellar medium — Extinction, emission, linear and circular
polarisation,
A&A 561, A82
Scicluna and Siebenmorgen, 2015,
Extinction and dust properties in a clumpy medium,
A&A 584, A108
Siebenmorgen and Heymann, 2012,
Polycyclic aromatic hydrocarbons in protoplanetary disks:
emission and X-ray destruction, A&A 543, A25
Krügel, 2008, An introduction to the physics of
interstellar dust. Textbook ISBN :9781584887072 9
Krügel and Siebenmorgen, 1994, on Fluffy grains:
Dust in protostellar cores and stellar disks,
A&A 288, 929
Siebenmorgen et al, 1992,
Dust model containing polycyclic aromatic hydrocarbons in various environments,
A&A 259, 614