Plot
? |
Symb
? |
Source
* |
OPS?
** |
Average ? |
Thresholds ? |
N_
data |
QC1
parameter |
Data
downloads |
Remarks |
| method |
value |
unit |
method |
value |
| 1 |
• | QC1DB |
no |
MEDIAN |
4081.320 |
nm |
VAL | 4081.0,4081.4 |
181 |
lambda_cent |
this |
last_yr |
all
|
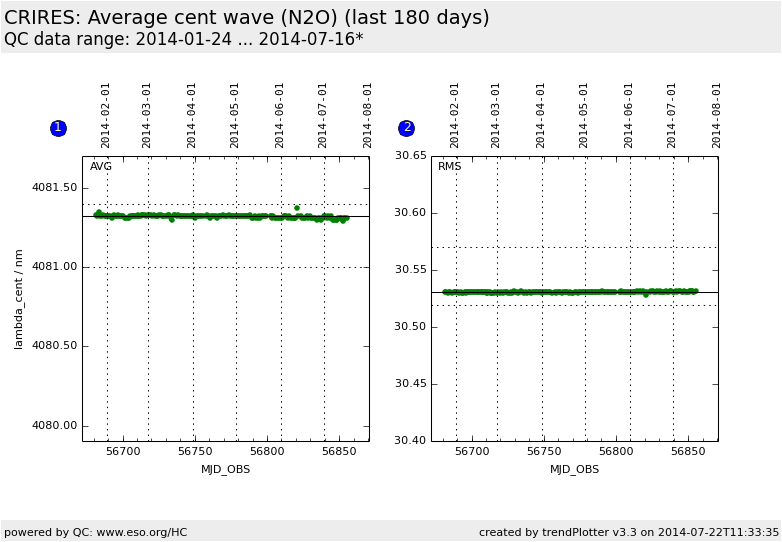
AVG center wavelength vs. time, WREF=4092.9 |
| 2 |
• | QC1DB |
no |
MEDIAN |
30.531 |
nm |
VAL | 30.52,30.57 |
181 |
lambda_cent |
this |
last_yr |
all
|
RMS of center wavelength vs. time, WREF=4092.9 |
| |
|
*Data sources: QC1DB: QC1 database; LOCAL: local text file | **OPS: OPSLOG data are included
|
Plot 1
scores:  9| 9|
| | data source: | crires_wave
(QC1 database) |
| dataset: | lambda_cent | • |
| median: | 4081.320 | nm |
| fixed thresholds: | 4081.0...4081.4 | nm |
| N_data plotted: | 181 |
| [click on plot for closeup] |
Plot 2
scores: 9|
| | data source: | crires_wave
(QC1 database) |
| dataset: | lambda_cent | • |
| median: | 30.531 | nm |
| fixed thresholds: | 30.52...30.57 | nm |
| N_data plotted: | 181 |
| [click on plot for closeup] |
Wavelength calibration: trending of central wavelength (averages).
This plot uses the average of the central wavelength on the four detectors and
the corresponding rms. The values are plotted vs. time. Historical plots show
also trending vs. grating
temperature (header key INS.TEMP4.VAL). Averages are only available for
Garching values. Monitoring is for N2O absorption cell measurements with
4092.9 nm reference wavelength.
General information
Click on any of the plots to see a close-up version.
The latest date is indicated on top of the plot, data points belonging to that date are specially marked.
If configured,
- statistical averages are indicated by a solid line, and thresholds by broken lines
- outliers are marked by a red asterisk. They are defined as data points outside the
threshold lines
- "aliens" (= data points outside the plot Y limits) are marked by a red arrow (↑ or ↓)
- you can download the data for each parameter set if the 'Data downloads' link shows up
|
