|
|
| FORS2 trending system: HISTORY report |
|
|
|
Last update: 2025-07-15T03:34:15 (UT)
|
|
|
|
|
*Date on this monitor changes at 21:00 UT |
|

|
|
|
Plot
? |
Symb
? |
Source
* |
Average ? |
Thresholds ? |
N_
data |
QC1
parameter |
Data
downloads |
Remarks |
| method |
value |
unit |
method |
value |
| 1 |
• | QC1DB |
MEDIAN |
1.62e+04 |
ADU |
VAL | 14000,24000 |
26 |
efficiency |
this |
last_yr |
all
|
|
| 2 |
• | QC1DB |
MEDIAN |
1.67e+04 |
ADU |
VAL | 14000,24000 |
26 |
efficiency |
this |
last_yr |
all
|
|
| 3 |
• | QC1DB |
MEDIAN |
2.65e+04 |
ADU |
VAL | 24000,38000 |
24 |
efficiency |
this |
last_yr |
all
|
|
| 4 |
• | QC1DB |
MEDIAN |
2.74e+04 |
ADU |
VAL | 24000,38000 |
24 |
efficiency |
this |
last_yr |
all
|
|
| |
|
*Data sources: QC1DB: QC1 database; LOCAL: local data source
|
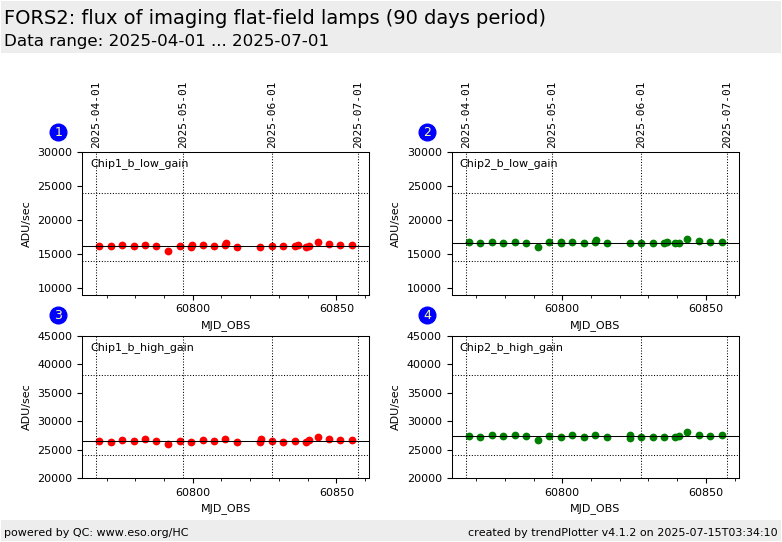
| Plot 1 | | data source: | fors2_scrflat
(QC1 database) |
| dataset: | efficiency | • |
| median: | 1.62e+04 | ADU |
| fixed thresholds: | 14000...24000 | ADU |
| N_data plotted: | 26 |
| [click plot for closeup] |
| Plot 2 | | data source: | fors2_scrflat
(QC1 database) |
| dataset: | efficiency | • |
| median: | 1.67e+04 | ADU |
| fixed thresholds: | 14000...24000 | ADU |
| N_data plotted: | 26 |
| [click plot for closeup] |
| Plot 3 | | data source: | fors2_scrflat
(QC1 database) |
| dataset: | efficiency | • |
| median: | 2.65e+04 | ADU |
| fixed thresholds: | 24000...38000 | ADU |
| N_data plotted: | 24 |
| [click plot for closeup] |
| Plot 4 | | data source: | fors2_scrflat
(QC1 database) |
| dataset: | efficiency | • |
| median: | 2.74e+04 | ADU |
| fixed thresholds: | 24000...38000 | ADU |
| N_data plotted: | 24 |
| [click plot for closeup] |
The FlatBlue+1 and FlatBlue+2 lamps are used for imaging screen flats.
The RMS is calculated from the master screen flat image pixel sample (2x2
binning) X: @200 @1800 and Y: @400 @800 covering the unvignetted area
of chip1 and chip2.
DB Name: fors2_scrflat
TPL.ID: FORS2_img_cal_scrflat
QC1 DB parameter: efficiency
General information
Click on any of the plots to see a close-up version.
The latest date is indicated on top of the plot.
If configured,
- data points belonging to the latest date are specially marked
- statistical averages are indicated by a solid line, and thresholds by broken lines
- outliers are marked by a red asterisk. They are defined as data points outside the
threshold lines
- "aliens" (= data points outside the plot Y limits) are marked by a red arrow (↑ or ↓)
- you can download the data for each parameter set if the 'Data downloads' link shows up
|