Plot
? |
Symb
? |
Source
* |
Average ? |
Thresholds ? |
N_
data |
QC1
parameter |
Data
downloads |
Remarks |
| method |
value |
unit |
method |
value |
| 1 |
• | QC1DB |
none |
|
e-/ADU |
none | |
72 |
gain |
all (full time range)
| gain for chip 1, high gain, R_SPECIAL |
| 1 |
• | QC1DB |
none |
|
e-/ADU |
none | |
224 |
gain |
all (full time range)
| gain for chip 1, high gain, non-R_SPECIAL |
| 1 |
o | QC1DB |
none |
|
e-/ADU |
none | |
296 |
gain |
all (full time range)
| gain for chip 1, high gain, all filters |
| 2 |
• | QC1DB |
none |
|
e-/ADU |
none | |
71 |
gain |
all (full time range)
| gain for chip 2, high gain, R_SPECIAL |
| 2 |
• | QC1DB |
none |
|
e-/ADU |
none | |
221 |
gain |
all (full time range)
| gain for chip 2, high gain, non-R_SPECIAL |
| 2 |
o | QC1DB |
none |
|
e-/ADU |
none | |
292 |
gain |
all (full time range)
| gain for chip 2, high gain, all filters |
| 3 |
• | QC1DB |
none |
|
e-/ADU |
none | |
73 |
gain |
all (full time range)
| gain for chip 1, low gain, R_SPECIAL |
| 3 |
• | QC1DB |
none |
|
e-/ADU |
none | |
273 |
gain |
all (full time range)
| gain for chip 1, low gain, non-R_SPECIAL |
| 3 |
o | QC1DB |
none |
|
e-/ADU |
none | |
346 |
gain |
all (full time range)
| gain for chip 1, low gain, all filters |
| 4 |
• | QC1DB |
none |
|
e-/ADU |
none | |
73 |
gain |
all (full time range)
| gain for chip 2, low gain, R_SPECIAL |
| 4 |
• | QC1DB |
none |
|
e-/ADU |
none | |
270 |
gain |
all (full time range)
| gain for chip 2, low gain, non-R_SPECIAL |
| 4 |
o | QC1DB |
none |
|
e-/ADU |
none | |
343 |
gain |
all (full time range)
| gain for chip 2, low gain, all filters |
| |
|
*Data sources: QC1DB: QC1 database; LOCAL: local data source
|
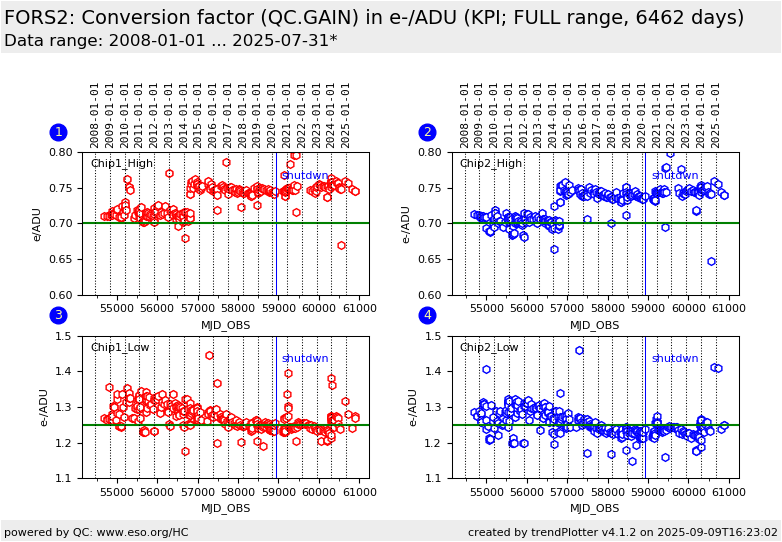
| Plot 1 | | data source: | fors2_detmon
(QC1 database) |
dataset:
(numbers below apply to this dataset) | gain | • |
| average: | none |
| thresholds: | none |
| N_data plotted: | 72 |
| (current) reference: | 0.7 |
| [click plot for closeup] |
| Plot 2 | | data source: | fors2_detmon
(QC1 database) |
dataset:
(numbers below apply to this dataset) | gain | • |
| average: | none |
| thresholds: | none |
| N_data plotted: | 71 |
| (current) reference: | 0.7 |
| [click plot for closeup] |
| Plot 3 | | data source: | fors2_detmon
(QC1 database) |
dataset:
(numbers below apply to this dataset) | gain | • |
| average: | none |
| thresholds: | none |
| N_data plotted: | 73 |
| (current) reference: | 1.25 |
| [click plot for closeup] |
| Plot 4 | | data source: | fors2_detmon
(QC1 database) |
dataset:
(numbers below apply to this dataset) | gain | • |
| average: | none |
| thresholds: | none |
| N_data plotted: | 73 |
| (current) reference: | 1.25 |
| [click plot for closeup] |
This is the instrument performance plot for FORS2 DETMON GAIN. The gain values (e-/ADU) are calculated by the detmon_opt_lg recipe (using the Photon Transfer Curve - PTC, method). The data come from a dedicated detmon calibrations consisting of sets of paired flat
fields and bias frames with identical exposure time.
The reference values are adopted from the FORS2 User Manual.
More information can be found on the plot tutorial page
General information
Click on any of the plots to see a close-up version.
The latest date is indicated on top of the plot.
If configured,
- data points belonging to the latest date are specially marked
- statistical averages are indicated by a solid line, and thresholds by broken lines
- outliers are marked by a red asterisk. They are defined as data points outside the
threshold lines
- "aliens" (= data points outside the plot Y limits) are marked by a red arrow (↑ or ↓)
- you can download the data for each parameter set if the 'Data downloads' link shows up
|
