Plot
? |
Symb
? |
Source
* |
Average ? |
Thresholds ? |
N_
data |
QC1
parameter |
Data
downloads |
Remarks |
| method |
value |
unit |
method |
value |
| 1 |
• | QC1DB |
none |
|
NONE |
none | |
72 |
non_linear |
all (full time range)
| non-linearity for chip 1, high gain, R_SPECIAL |
| 1 |
• | QC1DB |
none |
|
NONE |
none | |
224 |
non_linear |
all (full time range)
| non-linearity for chip 1, high gain, non-R_SPECIAL |
| 1 |
o | QC1DB |
none |
|
NONE |
none | |
296 |
non_linear |
all (full time range)
| non-linearity for chip 1, high gain, all filters |
| 2 |
• | QC1DB |
none |
|
NONE |
none | |
71 |
non_linear |
all (full time range)
| non-linearity for chip 2, high gain, R_SPECIAL |
| 2 |
• | QC1DB |
none |
|
NONE |
none | |
221 |
non_linear |
all (full time range)
| non-linearity for chip 2, high gain, non-R_SPECIAL |
| 2 |
o | QC1DB |
none |
|
NONE |
none | |
292 |
non_linear |
all (full time range)
| non-linearity for chip 2, high gain, all filters |
| 3 |
• | QC1DB |
none |
|
NONE |
none | |
73 |
non_linear |
all (full time range)
| non-linearity for chip 1, low gain, R_SPECIAL |
| 3 |
• | QC1DB |
none |
|
NONE |
none | |
273 |
non_linear |
all (full time range)
| non-linearity for chip 1, low gain, non-R_SPECIAL |
| 3 |
o | QC1DB |
none |
|
NONE |
none | |
346 |
non_linear |
all (full time range)
| non-linearity for chip 1, low gain, all filters |
| 4 |
• | QC1DB |
none |
|
NONE |
none | |
73 |
non_linear |
all (full time range)
| non-linearity for chip 2, low gain, R_SPECIAL |
| 4 |
• | QC1DB |
none |
|
NONE |
none | |
270 |
non_linear |
all (full time range)
| non-linearity for chip 2, low gain, non-R_SPECIAL |
| 4 |
o | QC1DB |
none |
|
NONE |
none | |
343 |
non_linear |
all (full time range)
| non-linearity for chip 2, low gain, all filters |
| |
|
*Data sources: QC1DB: QC1 database; LOCAL: local data source
|
| Plot 1 | | data source: | fors2_detmon
(QC1 database) |
dataset:
(numbers below apply to this dataset) | non_linear | • |
| average: | none |
| thresholds: | none |
| N_data plotted: | 72 |
| (current) reference: | 0.0025 |
| [click plot for closeup] |
| Plot 2 | | data source: | fors2_detmon
(QC1 database) |
dataset:
(numbers below apply to this dataset) | non_linear | • |
| average: | none |
| thresholds: | none |
| N_data plotted: | 71 |
| (current) reference: | 0.0051 |
| [click plot for closeup] |
| Plot 3 | | data source: | fors2_detmon
(QC1 database) |
dataset:
(numbers below apply to this dataset) | non_linear | • |
| average: | none |
| thresholds: | none |
| N_data plotted: | 73 |
| (current) reference: | 0.0064 |
| [click plot for closeup] |
| Plot 4 | | data source: | fors2_detmon
(QC1 database) |
dataset:
(numbers below apply to this dataset) | non_linear | • |
| average: | none |
| thresholds: | none |
| N_data plotted: | 73 |
| (current) reference: | 0.0094 |
| [click plot for closeup] |
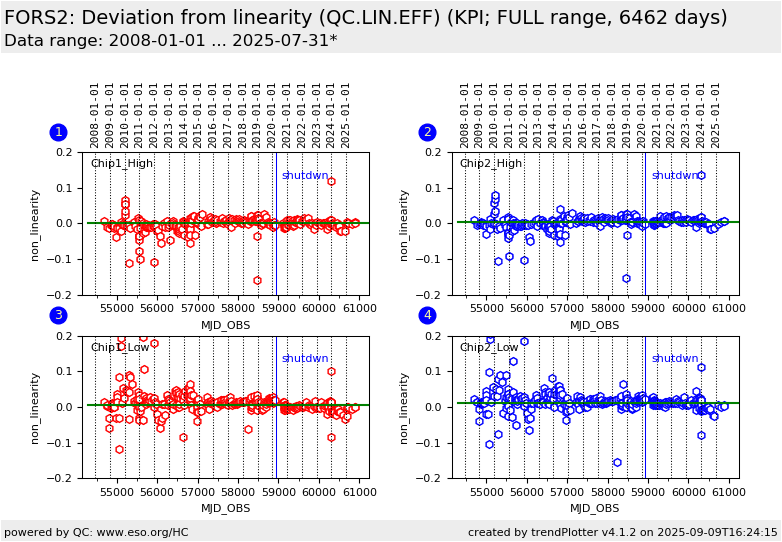
This is the instrument performance plot showing deviation from linearity calculated for two MIT detectors of FORS2 (Chip1 and Chip2) in two different read-out modes (High- and Low-gain). We monitor here a difference, at a given ref_level, between the flux obtained from
2nd order polynomial fit of flux vs. exposure time and the flux predicted by the linear term only, normalized by the polynomial flux.
Since data taken after 2009-10 rarely reach 60000 ADU we changed this
ref_level from 60000 ADU to 40000 ADU, starting 2009-10.
The respective reference values are currently identical to the average of measured data points.
More information can be found on the plot tutorial page
General information
Click on any of the plots to see a close-up version.
The latest date is indicated on top of the plot.
If configured,
- data points belonging to the latest date are specially marked
- statistical averages are indicated by a solid line, and thresholds by broken lines
- outliers are marked by a red asterisk. They are defined as data points outside the
threshold lines
- "aliens" (= data points outside the plot Y limits) are marked by a red arrow (↑ or ↓)
- you can download the data for each parameter set if the 'Data downloads' link shows up
|
