Plot
? |
Symb
? |
Source
* |
Average ? |
Thresholds ? |
N_
data |
QC1
parameter |
Data
downloads |
Remarks |
| method |
value |
unit |
method |
value |
| 1 |
• | QC1DB |
none |
|
NONE |
none | |
54 |
rel_l_offset |
all (full time range)
| relative deviation from expected linear polarization for the B band |
| 2 |
♦ | QC1DB |
none |
|
NONE |
none | |
94 |
rel_l_offset |
all (full time range)
| relative deviation from expected linear polarization for the V band |
| 3 |
▲ | QC1DB |
none |
|
NONE |
none | |
234 |
rel_l_offset |
all (full time range)
| relative deviation from expected linear polarization for the R band |
| |
|
*Data sources: QC1DB: QC1 database; LOCAL: local data source
|
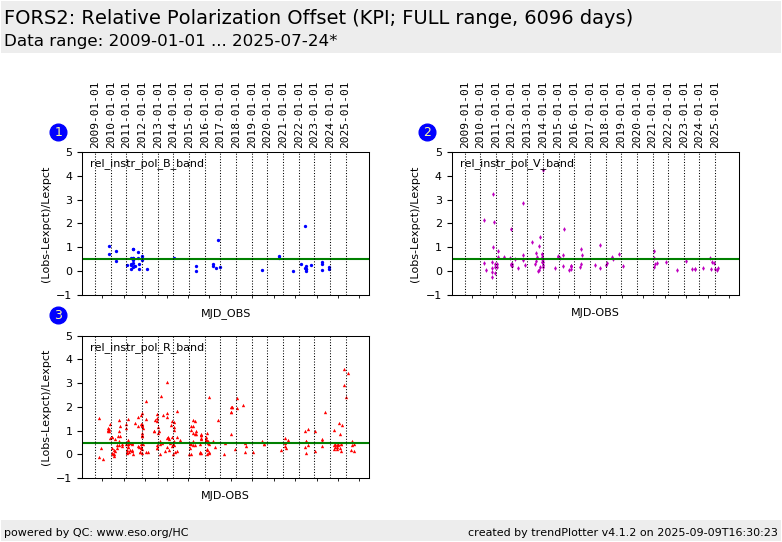
| Plot 1 | | data source: | fors2_std_pmos
(QC1 database) |
| dataset: | rel_l_offset | • |
| average: | none |
| thresholds: | none |
| N_data plotted: | 54 |
| (current) reference: | 0.5 |
| [click plot for closeup] |
| Plot 2 | | data source: | fors2_std_pmos
(QC1 database) |
| dataset: | rel_l_offset | ♦ |
| average: | none |
| thresholds: | none |
| N_data plotted: | 94 |
| (current) reference: | 0.5 |
| [click plot for closeup] |
| Plot 3 | | data source: | fors2_std_pmos
(QC1 database) |
| dataset: | rel_l_offset | ▲ |
| average: | none |
| thresholds: | none |
| N_data plotted: | 234 |
| (current) reference: | 0.5 |
| [click plot for closeup] |
This is the instrument performance plot for the FORS2 relative polarization offset.
For polarized standard stars the pipeline determines the difference between the measured linear polarization (Lobs) and the value tabulated in the catalogue (Lexpct). Since
polarization parameters are usually tabulated for broad-band filters the pipeline selects the broad-band filter closest to the central wavelength of the grism. The difference is then normalized by dividing through the tabulated value.
The reference value (0.5) currently corresponds to the median of the measured values.
General information
Click on any of the plots to see a close-up version.
The latest date is indicated on top of the plot.
If configured,
- data points belonging to the latest date are specially marked
- statistical averages are indicated by a solid line, and thresholds by broken lines
- outliers are marked by a red asterisk. They are defined as data points outside the
threshold lines
- "aliens" (= data points outside the plot Y limits) are marked by a red arrow (↑ or ↓)
- you can download the data for each parameter set if the 'Data downloads' link shows up
|
