Plot
? |
Symb
? |
Source
* |
Average ? |
Thresholds ? |
N_
data |
QC1
parameter |
Data
downloads |
Remarks |
| method |
value |
unit |
method |
value |
| 1 |
• | QC1DB |
MEDIAN |
-11.9 |
degrees |
none | |
15 |
phasediff_sc12 |
this |
last_yr |
all
|
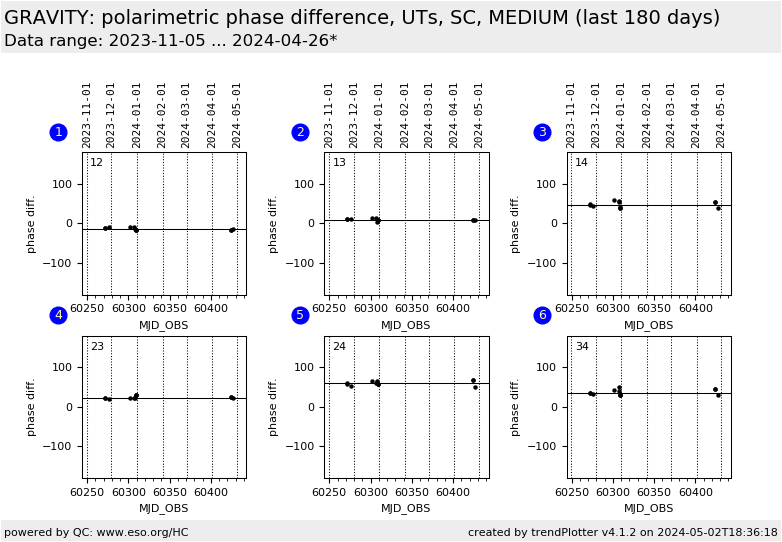
calibrator phase difference, UTs, base line 12, SC, MEDIUM resolution |
| 2 |
• | QC1DB |
MEDIAN |
12.6 |
degrees |
none | |
15 |
phasediff_sc13 |
this |
last_yr |
all
|
calibrator phase difference, UTs, base line 13, SC, MEDIUM resolution |
| 3 |
• | QC1DB |
MEDIAN |
41.6 |
degrees |
none | |
15 |
phasediff_sc14 |
this |
last_yr |
all
|
calibrator phase difference, UTs, base line 14, SC, MEDIUM resolution |
| 4 |
• | QC1DB |
MEDIAN |
26.1 |
degrees |
none | |
15 |
phasediff_sc23 |
this |
last_yr |
all
|
calibrator phase difference, UTs, base line 23, SC, MEDIUM resolution |
| 5 |
• | QC1DB |
MEDIAN |
57 |
degrees |
none | |
15 |
phasediff_sc24 |
this |
last_yr |
all
|
calibrator phase difference, UTs, base line 24, SC, MEDIUM resolution |
| 6 |
• | QC1DB |
MEDIAN |
30.4 |
degrees |
none | |
15 |
phasediff_sc34 |
this |
last_yr |
all
|
calibrator phase difference, UTs, base line 34, SC, MEDIUM resolution |
| |
|
*Data sources: QC1DB: QC1 database; LOCAL: local data source
|
Plot 1
scores: not implemented
| | data source: | gravity_vis
(QC1 database) |
| dataset: | phasediff_sc12 | • |
| median: | -11.9 | degrees |
| thresholds: | none | |
| N_data plotted: | 15 |
| [click plot for closeup] |
Plot 2
scores: not implemented
| | data source: | gravity_vis
(QC1 database) |
| dataset: | phasediff_sc13 | • |
| median: | 12.6 | degrees |
| thresholds: | none | |
| N_data plotted: | 15 |
| [click plot for closeup] |
Plot 3
scores: not implemented
| | data source: | gravity_vis
(QC1 database) |
| dataset: | phasediff_sc14 | • |
| median: | 41.6 | degrees |
| thresholds: | none | |
| N_data plotted: | 15 |
| [click plot for closeup] |
Plot 4
scores: not implemented
| | data source: | gravity_vis
(QC1 database) |
| dataset: | phasediff_sc23 | • |
| median: | 26.1 | degrees |
| thresholds: | none | |
| N_data plotted: | 15 |
| [click plot for closeup] |
Plot 5
scores: not implemented
| | data source: | gravity_vis
(QC1 database) |
| dataset: | phasediff_sc24 | • |
| median: | 57 | degrees |
| thresholds: | none | |
| N_data plotted: | 15 |
| [click plot for closeup] |
Plot 6
scores: not implemented
| | data source: | gravity_vis
(QC1 database) |
| dataset: | phasediff_sc34 | • |
| median: | 30.4 | degrees |
| thresholds: | none | |
| N_data plotted: | 15 |
| [click plot for closeup] |
Phase difference in calibrator observation of the two polarimetric beams for all six baselines.
Only for SPLIT polarimetry mode.
There are separate plots for AT and UT observations.
General information
Click on any of the plots to see a close-up version.
The latest date is indicated on top of the plot.
If configured,
- data points belonging to the latest date are specially marked
- statistical averages are indicated by a solid line, and thresholds by broken lines
- outliers are marked by a red asterisk. They are defined as data points outside the
threshold lines
- "aliens" (= data points outside the plot Y limits) are marked by a red arrow (↑ or ↓)
- you can download the data for each parameter set if the 'Data downloads' link shows up
|
