Plot
? |
Symb
? |
Source
* |
Average ? |
Thresholds ? |
N_
data |
QC1
parameter |
Data
downloads |
Remarks |
| method |
value |
unit |
method |
value |
| 1 |
• | QC1DB |
MEDIAN |
|
none |
none | |
0 |
tf_visamp_sc12_p1 |
this |
last_yr |
all
|
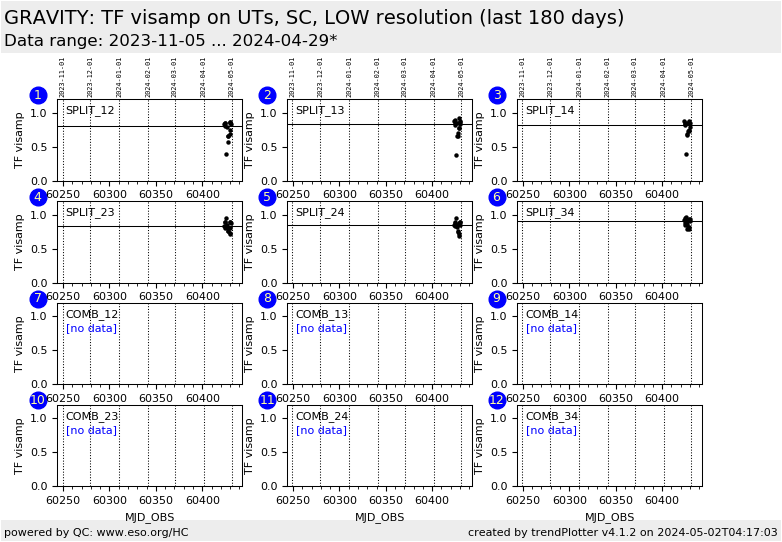
visamp, UT, base line 12, LOW resolution, SC, SPLIT polarimetry |
| 2 |
• | QC1DB |
MEDIAN |
|
none |
none | |
0 |
tf_visamp_sc13_p1 |
this |
last_yr |
all
|
visamp, UT, base line 13, LOW resolution, SC, SPLIT polarimetry |
| 3 |
• | QC1DB |
MEDIAN |
|
none |
none | |
0 |
tf_visamp_sc14_p1 |
this |
last_yr |
all
|
visamp, UT, base line 14, LOW resolution, SC, SPLIT polarimetry |
| 4 |
• | QC1DB |
MEDIAN |
|
none |
none | |
0 |
tf_visamp_sc23_p1 |
this |
last_yr |
all
|
visamp, UT, base line 23, LOW resolution, SC, SPLIT polarimetry |
| 5 |
• | QC1DB |
MEDIAN |
|
none |
none | |
0 |
tf_visamp_sc24_p1 |
this |
last_yr |
all
|
visamp, UT, base line 24, LOW resolution, SC, SPLIT polarimetry |
| 6 |
• | QC1DB |
MEDIAN |
|
none |
none | |
0 |
tf_visamp_sc34_p1 |
this |
last_yr |
all
|
visamp, UT, base line 34, LOW resolution, SC, SPLIT polarimetry |
| 7 |
• | QC1DB |
MEDIAN |
|
none |
none | |
0 |
tf_visamp_sc12_p1 |
this |
last_yr |
all
|
visamp, UT, base line 12, LOW resolution, SC, COMBINED polarimetry |
| 8 |
• | QC1DB |
MEDIAN |
|
none |
none | |
0 |
tf_visamp_sc13_p1 |
this |
last_yr |
all
|
visamp, UT, base line 13, LOW resolution, SC, COMBINED polarimetry |
| 9 |
• | QC1DB |
MEDIAN |
|
none |
none | |
0 |
tf_visamp_sc14_p1 |
this |
last_yr |
all
|
visamp, UT, base line 14, LOW resolution, SC, COMBINED polarimetry |
| 10 |
• | QC1DB |
MEDIAN |
|
none |
none | |
0 |
tf_visamp_sc23_p1 |
this |
last_yr |
all
|
visamp, UT, base line 23, LOW resolution, SC, COMBINED polarimetry |
| 11 |
• | QC1DB |
MEDIAN |
|
none |
none | |
0 |
tf_visamp_sc24_p1 |
this |
last_yr |
all
|
visamp, UT, base line 24, LOW resolution, SC, COMBINED polarimetry |
| 12 |
• | QC1DB |
MEDIAN |
|
none |
none | |
0 |
tf_visamp_sc34_p1 |
this |
last_yr |
all
|
visamp, UT, base line 34, LOW resolution, SC, COMBINED polarimetry |
| |
|
*Data sources: QC1DB: QC1 database; LOCAL: local data source
|
Plot 1
scores: not implemented
| | data source: | gravity_vis
(QC1 database) |
| dataset: | tf_visamp_sc12_p1 | • |
| median: | no data | none |
| thresholds: | none | |
| N_data plotted: | 0 |
| [click plot for closeup] |
Plot 2
scores: not implemented
| | data source: | gravity_vis
(QC1 database) |
| dataset: | tf_visamp_sc13_p1 | • |
| median: | no data | none |
| thresholds: | none | |
| N_data plotted: | 0 |
| [click plot for closeup] |
Plot 3
scores: not implemented
| | data source: | gravity_vis
(QC1 database) |
| dataset: | tf_visamp_sc14_p1 | • |
| median: | no data | none |
| thresholds: | none | |
| N_data plotted: | 0 |
| [click plot for closeup] |
Plot 4
scores: not implemented
| | data source: | gravity_vis
(QC1 database) |
| dataset: | tf_visamp_sc23_p1 | • |
| median: | no data | none |
| thresholds: | none | |
| N_data plotted: | 0 |
| [click plot for closeup] |
Plot 5
scores: not implemented
| | data source: | gravity_vis
(QC1 database) |
| dataset: | tf_visamp_sc24_p1 | • |
| median: | no data | none |
| thresholds: | none | |
| N_data plotted: | 0 |
| [click plot for closeup] |
Plot 6
scores: not implemented
| | data source: | gravity_vis
(QC1 database) |
| dataset: | tf_visamp_sc34_p1 | • |
| median: | no data | none |
| thresholds: | none | |
| N_data plotted: | 0 |
| [click plot for closeup] |
Plot 7
scores: not implemented
| | data source: | gravity_vis
(QC1 database) |
| dataset: | tf_visamp_sc12_p1 | • |
| median: | no data | none |
| thresholds: | none | |
| N_data plotted: | 0 |
| [click plot for closeup] |
Plot 8
scores: not implemented
| | data source: | gravity_vis
(QC1 database) |
| dataset: | tf_visamp_sc13_p1 | • |
| median: | no data | none |
| thresholds: | none | |
| N_data plotted: | 0 |
| [click plot for closeup] |
Plot 9
scores: not implemented
| | data source: | gravity_vis
(QC1 database) |
| dataset: | tf_visamp_sc14_p1 | • |
| median: | no data | none |
| thresholds: | none | |
| N_data plotted: | 0 |
| [click plot for closeup] |
Plot 10
scores: not implemented
| | data source: | gravity_vis
(QC1 database) |
| dataset: | tf_visamp_sc23_p1 | • |
| median: | no data | none |
| thresholds: | none | |
| N_data plotted: | 0 |
| [click plot for closeup] |
Plot 11
scores: not implemented
| | data source: | gravity_vis
(QC1 database) |
| dataset: | tf_visamp_sc24_p1 | • |
| median: | no data | none |
| thresholds: | none | |
| N_data plotted: | 0 |
| [click plot for closeup] |
Plot 12
scores: not implemented
| | data source: | gravity_vis
(QC1 database) |
| dataset: | tf_visamp_sc34_p1 | • |
| median: | no data | none |
| thresholds: | none | |
| N_data plotted: | 0 |
| [click plot for closeup] |
Transfer function visibility amplitudes per baseline from night-time calibrator measurements.
General information
Click on any of the plots to see a close-up version.
The latest date is indicated on top of the plot.
If configured,
- data points belonging to the latest date are specially marked
- statistical averages are indicated by a solid line, and thresholds by broken lines
- outliers are marked by a red asterisk. They are defined as data points outside the
threshold lines
- "aliens" (= data points outside the plot Y limits) are marked by a red arrow (↑ or ↓)
- you can download the data for each parameter set if the 'Data downloads' link shows up
|
