mirror sites: PL (internal link) HQ     [?]

Health Check monitor


CAL | HC | refs | QC
HealthCheck Monitor
   HOME | UsersGuide
  sl icon ALL INSTRUMENTS
 
all KPI reports
ISAAC:
spectro flats
Other HC:
QC links:
        [page auto-refreshes after 300 sec]   [stop | on]            [press Ctrl+Shift+R to enforce refresh of scores, dates and news]
ISAAC trending system: HEALTH CHECK report
HELP USERS-GUIDE MORE
Last update: 2013-12-16T10:12:16 (UT)
  | now: 2024-05-08T02:57:45 (UT) muc03 QC pipeline: isaac-6.1.3 (installed 2013-04-15)
same group: SW-Lamp-On SW-ProMean SW-ProStd SW-Lamp-Off   LW-Lamp-On LW-ProMean LW-ProStd LW-Lamp-Off
General news: NOTE: The Health Check and calChecker services are moved to qcFlow on an instrument by instrument basis. The current pages will not be updated any longer once the move has been finished.
ISAAC news: 2013-12-16: due to ISAAC decommissioning, refreshing of the health checks disabled
Report news:
DATE*: [?] 2013-12-09
report | NLT
2013-12-10
report | NLT
2013-12-11
report | NLT
2013-12-12
report | NLT
2013-12-13
no data | NLT
2013-12-14
no data | NLT
2013-12-15
no data | NLT
P...
Product quality:
products products products products no products no products no products
  last OPSLOG data:
2013-11-25*

last files ...
[an error occurred while processing this directive]
monitor

scores&comments | history ... | plot tutorial ... | contact               [?]
*Date on this monitor changes at 21:00 UT
Print: Information and research:
- png file - advanced studies: QC1 browser | QC1 plotter
  • 2007-04-05 migrated to trendPlotter
Plot
?
Symb
?
Source
*
OPS?
**
Average ? Thresholds ? N_
data
QC1
parameter
Data
downloads
Remarks
method value unit method value
1 QC1DB yes (0) MEDIAN 7.13e+03 ADU VAL400,13000 36 qc_specflat_ncounts this | last_yr | all Halogen lamp flux for LW, LR, SL
2 QC1DB yes (0) MEDIAN 255 ADU VAL400,13000 2 qc_specflat_ncounts this | last_yr | all Halogen lamp flux for LW, LR, M
3 xQC1DB yes (0) MEDIAN 3.12e+03 ADU VAL400,13000 106 qc_specflat_ncounts this | last_yr | all Halogen lamp flux for LW, MR, SL
4 xQC1DB yes (0) MEDIAN 824 ADU VAL400,13000 13 qc_specflat_ncounts this | last_yr | all Halogen lamp flux for LW, MR, M
*Data sources: QC1DB: QC1 database; LOCAL: local text file | **OPS: OPSLOG data are included
Plot 1
scores: not implemented
data source:isaac_spflat
(QC1 database)
dataset:qc_specflat_ncounts
median:7.13e+03ADU
fixed thresholds:400...13000ADU
N_data plotted:36
[click on plot for closeup]
Plot 2
scores: not implemented
data source:isaac_spflat
(QC1 database)
dataset:qc_specflat_ncounts
median:255ADU
fixed thresholds:400...13000ADU
N_data plotted:2
[click on plot for closeup]
Plot 3
scores: not implemented
data source:isaac_spflat
(QC1 database)
dataset:qc_specflat_ncountsx
median:3.12e+03ADU
fixed thresholds:400...13000ADU
N_data plotted:106
[click on plot for closeup]
Plot 4
scores: not implemented
data source:isaac_spflat
(QC1 database)
dataset:qc_specflat_ncountsx
median:824ADU
fixed thresholds:400...13000ADU
N_data plotted:13
[click on plot for closeup]
This plot

This is the trending plot for the ISAAC QC parameters derived from long wavelength arm (LW) spectroscopic flat frames. 
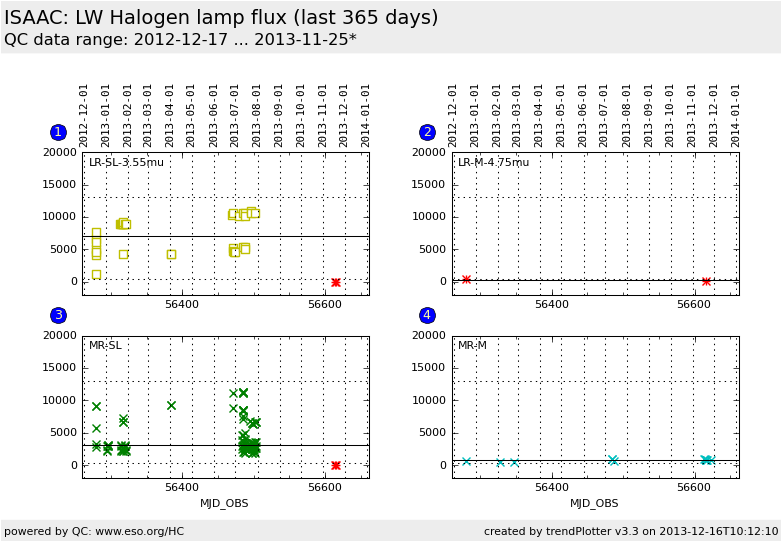
These plots describe:
1. dark subtracted counts of the master spectroscopic flat LW-LR-SL (3.55 um), all slits.
2. dark subtracted counts of the master spectroscopic flat LW-LR-M (4.75 um), all slits.
3. dark subtracted counts of the master spectroscopic flat LW-MR-SL, all slits.
4. dark subtracted counts of the master spectroscopic flat LW-MR-M, all slits.


General information

Click on any of the plots to see a close-up version.

If applicable, the latest values from Paranal ops logs are plotted as blue dots. More information about those values, including a download option, is available in the OPS column.

The latest date is indicated on top of the plot, data points belonging to that date are specially marked.

If configured,

  • statistical averages are indicated by a solid line, and thresholds by broken lines
  • outliers are marked by a red asterisk. They are defined as data points outside the threshold lines
  • "aliens" (= data points outside the plot Y limits) are marked by a red arrow ( or )
  • you can download the data for each parameter set if the 'Data downloads' link shows up