MATISSE: Kappa matrix
| |
| HC PLOTS |
| Ratio, flux, shift, zoom |
 |
|
QC1 database (advanced users):
browse |
plot
|
The laboratory Kappa matrix provides a measurement of the intensity ratio between the beams. It also provides a measurement of the anamorphosis factor (relative shift and zoom) between the interferometric and the photometric beams. For now this measurement is done only for the HAWAII (LM band) detector
With this calibration, we can monitor the transmission of MATISSE
The input data are: a
series of images containing the laboratory background or the sky
(KAPPA_HOTDARK or KAPPA_SKY), a series of images for each shutter
with the internal source or the target (KAPPA_SRC or KAPPA_OBJ), the
static shift map (SHIFT_MAP), the static bad pixel map (BADPIX),
the static nonlinearity map (NONLINEARITY) and the observation specific
flatfield map (OBS_FLATFIELD)
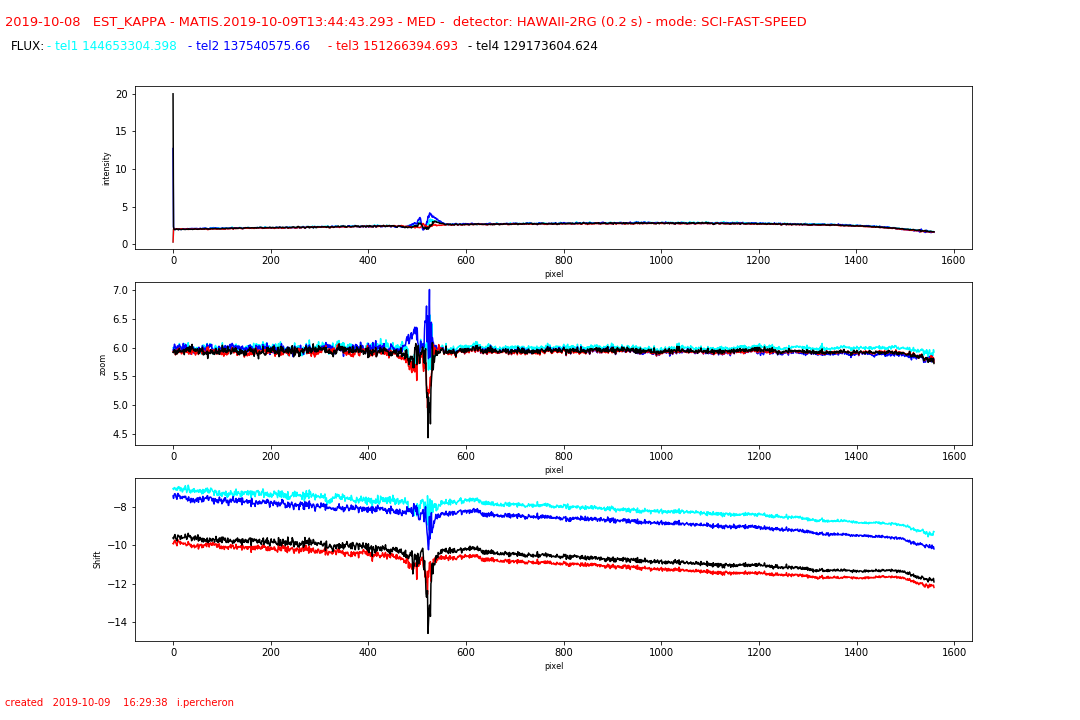 |
Intensity, shift and zoom
|
 KAPPA_MATRIX
The KAPPA matrix recipe calculates the intensity ratio,
the relative shift and zoom between each photometric channel and the
interferometric one for each spectral channel. The raw input data are: a
series of images containing the laboratory background or the sky
(KAPPA_HOTDARK or KAPPA_SKY), a series of images for each shutter
with the internal source or the target (KAPPA_SRC or KAPPA_OBJ).
Additional calibration products are also needed :
static shift map (SHIFT_MAP), the static bad pixel map (BADPIX),
the static nonlinearity map (NONLINEARITY) and the observation specific
flatfield map (OBS_FLATFIELD).
The laboratory kappa matrix is used to get rid of the fringe contrast-loss due to the non perfect overlap of the interfering beams. The photometric beams recorded on the target have to be transformed in a way that they have the same position, shape and intensity as the interferomtric channel.
QC1_parameters
| FITS key |
QC1 database: table, name |
definition |
class* |
HC_plot** |
more docu |
| QC.DET..FLUX1 | matisse_kappamatrix..flux_kappa_p1 | flux and photometric channel 1 | HC | | [docuSys coming] |
| QC.DET..IRATIO1.MEAN | matisse_kappamatrix..ratio_kappa_p1 | mean intensity ratio and photometric channel 1 | HC | | [docuSys coming] |
| QC.DET..IRATIO1.STDEV | matisse_kappamatrix..stdev_ratio_kappa_p1 | Standard deviation of the intensity ratio and photometric channel 1 | | | [docuSys coming] |
| QC.DET..IRATIO2.MEAN | matisse_kappamatrix..ratio_kappa_p2 | mean intensity ratio and photometric channel 2 | HC | | [docuSys coming] |
| QC.DET..SHIFT1.MEAN | matisse_kappamatrix..shift_kappa_p1 | mean spatial SHIFT and photometric channel 1 (pixels) | HC | | [docuSys coming] |
| QC.DET..SHIFT1.STDEV | matisse_kappamatrix..stdev_shift_kappa_p1 | Standard deviation of the spatial shift and photometric channel 1 (pixels) | | | [docuSys coming] |
| QC.DET..ZOOM1.MEAN | matisse_kappamatrix..zoom_kappa_p1 | mean zoom factor and photometric channel 1 | HC | | [docuSys coming] |
| QC.DET..ZOOM1.STDEV | matisse_kappamatrix..stdev_zoom_kappa_p1 | Standard deviation of the mean zoom factor and photometric channel 1 | | | [docuSys coming] |
*Class: KPI - instrument performance; HC - instrument health; CAL - calibration quality; ENG - engineering parameter
**There might be more than one. |
Trending
The trending
plot shows the ratio between the interferometric and photometric channels.
There is also a monitoring of the FLUX, SHIFT and ZOOM calculated for the different set-ups
Scoring&thresholds KAPPA_MATRIX
The Health Check plots are not scored.
The thresholds (ratio, zoom and shift) for the ABs are set to detect jumps which could mean misalignment of the different beams compared to each other.
History
The ratio, zoom and shift parameter should be the same for the photometric beams and constant.
Algorithm KAPPA_MATRIX
The recipe used is the mat_est_kappa
|
