Plot
? |
Symb
? |
Source
* |
Average ? |
Thresholds ? |
N_
data |
QC1
parameter |
Data
downloads |
Remarks |
| method |
value |
unit |
method |
value |
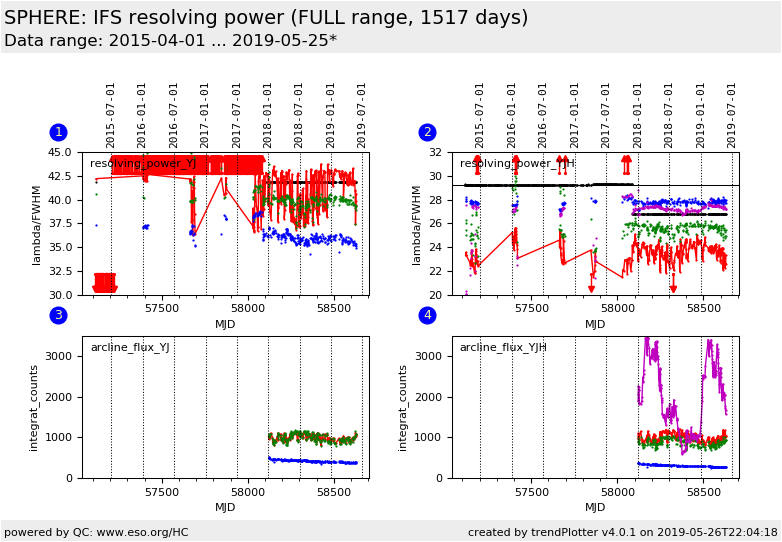
| 1 |
• | QC1DB |
MEDIAN |
46.7101 |
unitless |
none | |
800 |
qc_resolv_power |
all (full time range)
| median resolving power, lambda/FWHM, YJ prism |
| 1 |
• | LOCAL |
none |
|
NONE |
none | |
342 |
qc_resolv_power |
n/a |
resolving power in 0.9877 first (bluest) arc line |
| 1 |
• | LOCAL |
none |
|
NONE |
none | |
342 |
qc_resolv_power |
n/a |
resolving power in 1.1237 second arc line |
| 1 |
• | LOCAL |
none |
|
NONE |
none | |
342 |
qc_resolv_power |
n/a |
resolving power in 1.3094 third arc line |
| 2 |
• | QC1DB |
MEDIAN |
29.2358 |
unitless |
none | |
785 |
qc_resolv_power |
all (full time range)
| median resolving power, lambda/FWHM, YJH prism |
| 2 |
• | LOCAL |
none |
|
NONE |
none | |
340 |
qc_resolv_power |
n/a |
resolving power in 0.9877 first (bluest) arc line |
| 2 |
• | LOCAL |
none |
|
NONE |
none | |
340 |
qc_resolv_power |
n/a |
resolving power in 1.1237 second arc line |
| 2 |
• | LOCAL |
none |
|
NONE |
none | |
340 |
qc_resolv_power |
n/a |
resolving power in 1.3094 third arc line |
| 2 |
• | LOCAL |
none |
|
NONE |
none | |
340 |
qc_resolv_power |
n/a |
resolving power in 1.5451 fourth arc line |
| 3 |
• | LOCAL |
none |
|
NONE |
none | |
258 |
qc_resolv_power |
n/a |
flux in 0.9877 first (bluest) arc line (nm * counts) |
| 3 |
• | LOCAL |
none |
|
NONE |
none | |
258 |
qc_resolv_power |
n/a |
flux in 1.1237 second arc line (nm * counts) |
| 3 |
• | LOCAL |
none |
|
NONE |
none | |
258 |
qc_resolv_power |
n/a |
flux in 1.3094 third arc line (nm * counts) |
| 4 |
• | LOCAL |
none |
|
NONE |
none | |
242 |
qc_resolv_power |
n/a |
flux in 0.9877 first (bluest) arc line (nm * counts) |
| 4 |
• | LOCAL |
none |
|
NONE |
none | |
242 |
qc_resolv_power |
n/a |
flux in 1.1237 second arc line (nm * counts) |
| 4 |
• | LOCAL |
none |
|
NONE |
none | |
242 |
qc_resolv_power |
n/a |
flux in 1.3094 third arc line (nm * counts) |
| 4 |
• | LOCAL |
none |
|
NONE |
none | |
242 |
qc_resolv_power |
n/a |
flux in 1.5451 fourth arc line (nm * counts) |
| |
|
*Data sources: QC1DB: QC1 database; LOCAL: local data source
|
