[page auto-refreshes after 300 sec]   [stop | on]            [press Ctrl+Shift+R to enforce refresh of scores, dates and news]
SPHERE trending system: FULL report
HELP USERS-GUIDE MORE
Last update: 2021-05-17T04:47:42 (UT)
  | now: 2025-12-19T07:23:37 (UT) muc03 QC pipeline: spher-0.42.0b (installed 2021-03-01)
close window history: 2015 2016 2017 2018 2019 2020 2021   HEALTH FULL
  ... ... ... ... ...
*Date on this monitor changes at 21:00 UT
png: Information and research:
- png file - advanced studies: QC1 browser | QC1 plotter
Plot
?
Symb
?
Source
*
Average ? Thresholds ? N_
data
QC1
parameter
Data
downloads
Remarks
method value unit method value
1 QC1DB MEDIAN -1.2026 unitless none  37 dispersion all (full time range) dispersion PRI_LRS
2 QC1DB MEDIAN -9.1015 unitless none  16 dispersion all (full time range) dispersion GRI_MRS
3 QC1DB MEDIAN 0.0748752 unitless none  37 lambda0 all (full time range) wavelength offset in pixel GRI_MRS
4 QC1DB MEDIAN -0.626513 unitless none  16 lambda0 all (full time range) wavelength offset in pixel PRI_LRS
*Data sources: QC1DB: QC1 database; LOCAL: local data source
Plot 1
scores: not implemented
data source:sphere_irdis_wave
(QC1 database)
dataset:dispersion
median:-1.2026unitless
thresholds:none 
N_data plotted:37
[click plot for closeup]
Plot 2
scores: not implemented
data source:sphere_irdis_wave
(QC1 database)
dataset:dispersion
median:-9.1015unitless
thresholds:none 
N_data plotted:16
[click plot for closeup]
Plot 3
scores: not implemented
data source:sphere_irdis_wave
(QC1 database)
dataset:lambda0
median:0.0748752unitless
thresholds:none 
N_data plotted:37
[click plot for closeup]
Plot 4
scores: not implemented
data source:sphere_irdis_wave
(QC1 database)
dataset:lambda0
median:-0.626513unitless
thresholds:none 
N_data plotted:16
[click plot for closeup]
This plot

For plots LSS_WAVE2 (arc line fluxes from the IRDIS LSS grism setup) and IRDIS_LSS_WAVE4 (arc line fluxes for the IRDIS LSS prism setup), the FULL version of box 3 shows the long-term behavior of the L3=1.545 mu lamp. In addition the scaled long-term behaviour of flux of the same lamp as registered in the much more frequently acquired IFS WAVE calibrations is shown, to visualize deviations of the LSS L3=1.545mu flux from the known long-term behavior.  


General information

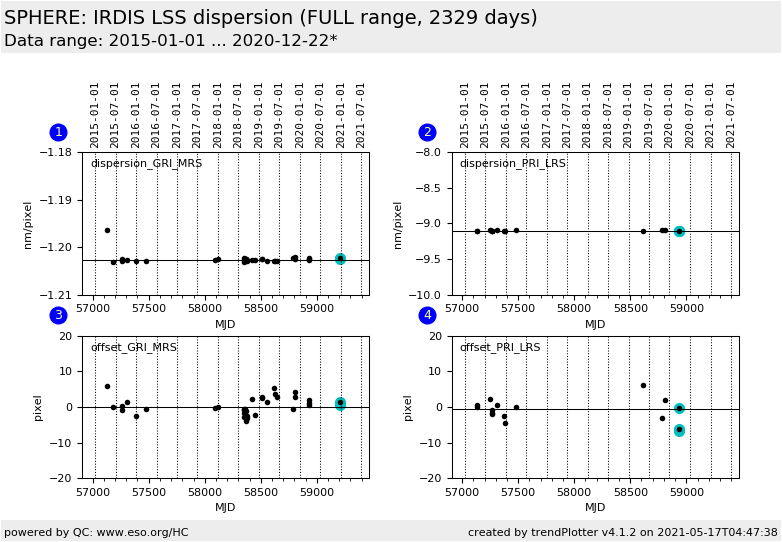
Click on any of the plots to see a close-up version.

The latest date is indicated on top of the plot.

If configured,

  • data points belonging to the latest date are specially marked
  • statistical averages are indicated by a solid line, and thresholds by broken lines
  • outliers are marked by a red asterisk. They are defined as data points outside the threshold lines
  • "aliens" (= data points outside the plot Y limits) are marked by a red arrow ( or )
  • you can download the data for each parameter set if the 'Data downloads' link shows up