Plot
? |
Symb
? |
Source
* |
Average ? |
Thresholds ? |
N_
data |
QC1
parameter |
Data
downloads |
Remarks |
| method |
value |
unit |
method |
value |
| 1 |
• | QC1DB |
none |
|
ADU |
none | |
982 |
qc_ron |
all (full time range)
| setup: DIT=2, NDIT=40, Nondest |
| 2 |
• | QC1DB |
none |
|
ADU |
none | |
980 |
qc_ron |
all (full time range)
| setup: DIT=30, NDIT=15, Nondest |
| |
|
*Data sources: QC1DB: QC1 database; LOCAL: local data source
|
| Plot 1 | | data source: | sphere_ifs_dark
(QC1 database) |
| dataset: | qc_ron | • |
| average: | none |
| thresholds: | none |
| N_data plotted: | 982 |
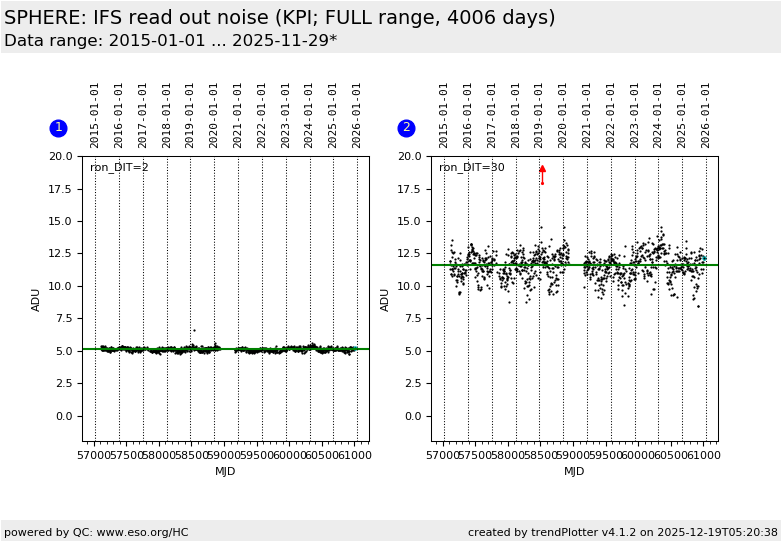
| (current) reference: | 5.12 |
| [click plot for closeup] |
| Plot 2 | | data source: | sphere_ifs_dark
(QC1 database) |
| dataset: | qc_ron | • |
| average: | none |
| thresholds: | none |
| N_data plotted: | 980 |
| (current) reference: | 11.6 |
| [click plot for closeup] |
According to
- VLT-SPE-SPH-14690-0083 (SPHERE Technical Specification)
- VLT-MAN-SPH-14690-0430 P104.0
The IFS detector read out noise is specified to be lower than 15e-. Given
the gain (see user manual) of 1.8 e-/ADU, this results in 8.33 ADU (IFS).
Please note the temperature dependence documented in the FULL plots.
Evaluation:
For IFS, DIT=2 the ron is below the specification, but for DIT=30 the
detector is underperformant. More precisely: The detetctor read noise
and the dark level induced photon noise at DIT=30 cannot be disentangled,
resulting in a measurement of the statistical noise of 11 ADU, while the
detector ron contribution alone might be still below the specification.
As the KPI plot reference value we choose the long-term average 5.12 ADU
(DIT=2) and 11.6 ADU (DIT=30)
General information
Click on any of the plots to see a close-up version.
The latest date is indicated on top of the plot.
If configured,
- data points belonging to the latest date are specially marked
- statistical averages are indicated by a solid line, and thresholds by broken lines
- outliers are marked by a red asterisk. They are defined as data points outside the
threshold lines
- "aliens" (= data points outside the plot Y limits) are marked by a red arrow (↑ or ↓)
- you can download the data for each parameter set if the 'Data downloads' link shows up
|
