SPHERE trending system: KPI report
Last update: 2025-12-19T05:21:24 (UT)
[enable javascript for displaying time difference!]
General news:
NOTE: The Health Check and calChecker services are moved to qcFlow on an instrument by instrument basis. The current pages will not be updated any longer once the move has been finished.
SPHERE news:
Note that the current Health Check monitor runs with an incomplete pipeline and an incomplete set of QC1 parameters.
QCG can currently not guarantee completeness and significance at the usual level.
Report news:
Plot? Symb? Source Average ? Thresholds ? N_ QC1 Data Remarks
method value unit method value
1
• QC1DB none MAG none 94 qc_zpoint_corrND
all (full time range)
V-band, chip 1, closed loop
1
• QC1DB none MAG none 77 qc_zpoint_corrND
all (full time range)
V-band, chip 1, open loop
2
• QC1DB none MAG none 92 qc_zpoint_corrND
all (full time range)
R-band, chip 1, closed loop
2
• QC1DB none MAG none 78 qc_zpoint_corrND
all (full time range)
R-band, chip 1, open loop
3
• QC1DB none MAG none 89 qc_zpoint_corrND
all (full time range)
I-band, chip 1, closed loop
3
• QC1DB none MAG none 75 qc_zpoint_corrND
all (full time range)
I-band, chip 1, open loop
4
• QC1DB none MAG none 94 qc_zpoint_corrND
all (full time range)
V-band, chip 2, closed loop
4
• QC1DB none MAG none 77 qc_zpoint_corrND
all (full time range)
V-band, chip 2, open loop
5
• QC1DB none MAG none 92 qc_zpoint_corrND
all (full time range)
R-band, chip 2, closed loop
5
• QC1DB none MAG none 78 qc_zpoint_corrND
all (full time range)
R-band, chip 2, open loop
6
• QC1DB none MAG none 89 qc_zpoint_corrND
all (full time range)
I-band, chip 2, closed loop
6
• QC1DB none MAG none 75 qc_zpoint_corrND
all (full time range)
I-band, chip 2, open loop
*Data sources: QC1DB: QC1 database; LOCAL: local data source
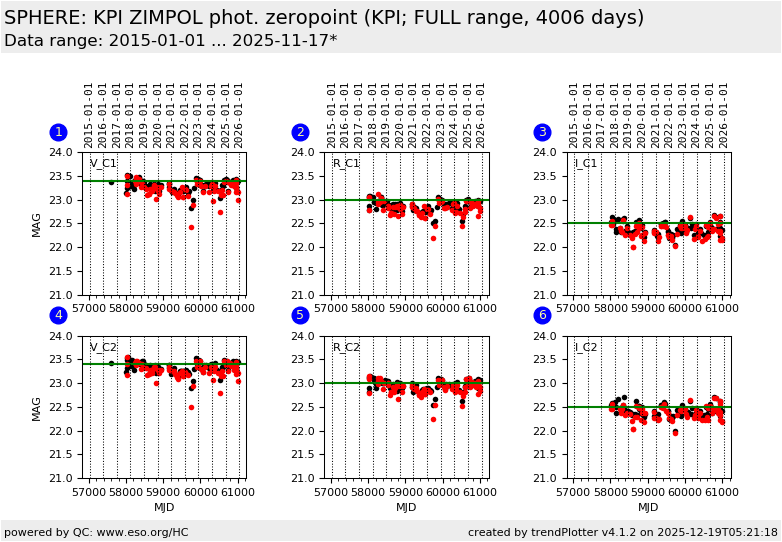
Plot 1 data source: sphere_zimpol_stdphot_img dataset: qc_zpoint_corrND • average: none thresholds: none N_data plotted: 94 (current) reference: 23.4 [click plot for closeup]
Plot 2 data source: sphere_zimpol_stdphot_img dataset: qc_zpoint_corrND • average: none thresholds: none N_data plotted: 92 (current) reference: 23.0 [click plot for closeup]
Plot 3 data source: sphere_zimpol_stdphot_img dataset: qc_zpoint_corrND • average: none thresholds: none N_data plotted: 89 (current) reference: 22.5 [click plot for closeup]
Plot 4 data source: sphere_zimpol_stdphot_img dataset: qc_zpoint_corrND • average: none thresholds: none N_data plotted: 94 (current) reference: 23.4 [click plot for closeup]
Plot 5 data source: sphere_zimpol_stdphot_img dataset: qc_zpoint_corrND • average: none thresholds: none N_data plotted: 92 (current) reference: 23.0 [click plot for closeup]
Plot 6 data source: sphere_zimpol_stdphot_img dataset: qc_zpoint_corrND • average: none thresholds: none N_data plotted: 89 (current) reference: 22.5 [click plot for closeup]
This plot
This plot shows the ZIMPOL photometric zeropoints, derived from photometric standard stars acquired in imaging mode.
General information
Click on any of the plots to see a close-up version .
The latest date is indicated on top of the plot.
If configured,
data points belonging to the latest date are specially marked statistical averages are indicated by a solid line, and thresholds by broken lines outliers are marked by a red asterisk. They are defined as data points outside the
threshold lines "aliens" (= data points outside the plot Y limits) are marked by a red arrow (↑ ↓ you can download the data for each parameter set if the 'Data downloads' link shows up
