|
|
| SPHERE trending system: HEALTH CHECK report |
|
|
| Last update: 2016-11-07T11:13:17 (UT)
|
|
|
|
|
|
|
*Date on this monitor changes at 21:00 UT |
|

|
|
|
Plot
? |
Symb
? |
Source
* |
Average ? |
Thresholds ? |
N_
data |
QC1
parameter |
Data
downloads |
Remarks |
| method |
value |
unit |
method |
value |
| 1 |
• | QC1DB |
MEDIAN |
0.061939 |
fractional |
VAL | 0.03,0.10 |
91 |
qc_fpn |
this |
last_yr |
all
|
narrow band laser lamp 1 fixed pattern noise |
| 2 |
• | QC1DB |
MEDIAN |
0.081344 |
fractional |
VAL | 0.05,0.12 |
91 |
qc_fpn |
this |
last_yr |
all
|
narrow band laser lamp 2 fixed pattern noise |
| 3 |
• | QC1DB |
MEDIAN |
0.037106 |
fractional |
VAL | 0.01,0.08 |
91 |
qc_fpn |
this |
last_yr |
all
|
narrow band laser lamp 3 fixed pattern noise |
| 4 |
• | QC1DB |
MEDIAN |
0.049993 |
fractional |
VAL | 0.02,0.10 |
92 |
qc_fpn |
this |
last_yr |
all
|
broad band halogen lamp fixed pattern noise |
| |
|
*Data sources: QC1DB: QC1 database; LOCAL: local data source
|
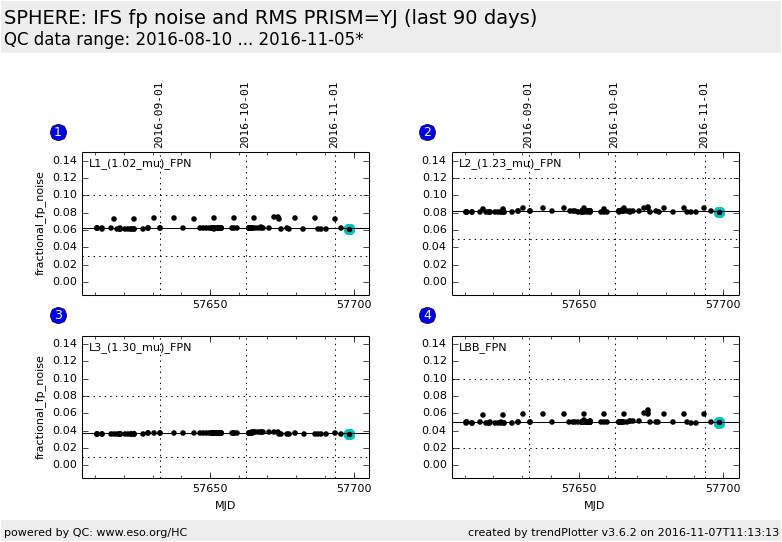
Plot 1
scores: no current data
| | data source: | sphere_ifs_dflat
(QC1 database) |
| dataset: | qc_fpn | • |
| median: | 0.061939 | fractional |
| fixed thresholds: | 0.03...0.1 | fractional |
| N_data plotted: | 91 |
| [click on plot for closeup] |
Plot 2
scores: no current data
| | data source: | sphere_ifs_dflat
(QC1 database) |
| dataset: | qc_fpn | • |
| median: | 0.081344 | fractional |
| fixed thresholds: | 0.05...0.12 | fractional |
| N_data plotted: | 91 |
| [click on plot for closeup] |
Plot 3
scores: no current data
| | data source: | sphere_ifs_dflat
(QC1 database) |
| dataset: | qc_fpn | • |
| median: | 0.037106 | fractional |
| fixed thresholds: | 0.01...0.08 | fractional |
| N_data plotted: | 91 |
| [click on plot for closeup] |
Plot 4
scores: no current data
| | data source: | sphere_ifs_dflat
(QC1 database) |
| dataset: | qc_fpn | • |
| median: | 0.049993 | fractional |
| fixed thresholds: | 0.02...0.1 | fractional |
| N_data plotted: | 92 |
| [click on plot for closeup] |
This plot shows the mean fixed pattern noise derived from LASER illuminated imaging flats.
General information
Click on any of the plots to see a close-up version.
The latest date is indicated on top of the plot.
If configured,
- data points belonging to the latest date are specially marked
- statistical averages are indicated by a solid line, and thresholds by broken lines
- outliers are marked by a red asterisk. They are defined as data points outside the
threshold lines
- "aliens" (= data points outside the plot Y limits) are marked by a red arrow (↑ or ↓)
- you can download the data for each parameter set if the 'Data downloads' link shows up
|