|
|
| SPHERE trending system: HEALTH CHECK report |
|
|
| Last update: 2016-10-11T09:05:11 (UT)
|
|
|
[an error occurred while processing this directive]
[an error occurred while processing this directive]

|
|
|
Plot
? |
Symb
? |
Source
* |
Average ? |
Thresholds ? |
N_
data |
QC1
parameter |
Data
downloads |
Remarks |
| method |
value |
unit |
method |
value |
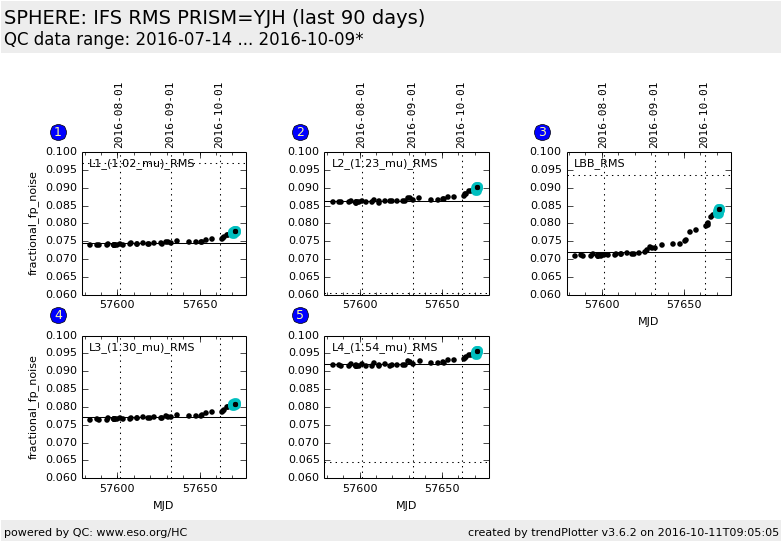
| 1 |
• | QC1DB |
MEDIAN |
0.074507 |
ADU |
30% | ± 0.0223521 |
43 |
qc_rms |
this |
last_yr |
all
|
narrow band laser lamp 1 fixed pattern noise |
| 2 |
• | QC1DB |
MEDIAN |
0.086358 |
ADU |
30% | ± 0.0259074 |
43 |
qc_rms |
this |
last_yr |
all
|
narrow band laser lamp 2 fixed pattern noise |
| 3 |
• | QC1DB |
MEDIAN |
0.071888 |
ADU |
30% | ± 0.0215664 |
43 |
qc_rms |
this |
last_yr |
all
|
broad band halogen lamp fixed pattern noise |
| 4 |
• | QC1DB |
MEDIAN |
0.077106 |
ADU |
30% | ± 0.0231318 |
43 |
qc_rms |
this |
last_yr |
all
|
narrow band laser lamp 3 fixed pattern noise |
| 5 |
• | QC1DB |
MEDIAN |
0.092024 |
ADU |
30% | ± 0.0276072 |
43 |
qc_rms |
this |
last_yr |
all
|
narrow band laser lamp 4 fixed pattern noise |
| |
|
*Data sources: QC1DB: QC1 database; LOCAL: local data source
|
Plot 1
scores: no current data
| | data source: | sphere_ifs_dflat
(QC1 database) |
| dataset: | qc_rms | • |
| median: | 0.074507 | ADU |
| rel. thresholds: ±30% | 0.0521549...0.0968591 | ADU |
| N_data plotted: | 43 |
| [click on plot for closeup] |
Plot 2
scores: no current data
| | data source: | sphere_ifs_dflat
(QC1 database) |
| dataset: | qc_rms | • |
| median: | 0.086358 | ADU |
| rel. thresholds: ±30% | 0.0604506...0.1122654 | ADU |
| N_data plotted: | 43 |
| [click on plot for closeup] |
Plot 3
scores: no current data
| | data source: | sphere_ifs_dflat
(QC1 database) |
| dataset: | qc_rms | • |
| median: | 0.071888 | ADU |
| rel. thresholds: ±30% | 0.0503216...0.0934544 | ADU |
| N_data plotted: | 43 |
| [click on plot for closeup] |
Plot 4
scores: no current data
| | data source: | sphere_ifs_dflat
(QC1 database) |
| dataset: | qc_rms | • |
| median: | 0.077106 | ADU |
| rel. thresholds: ±30% | 0.0539742...0.1002378 | ADU |
| N_data plotted: | 43 |
| [click on plot for closeup] |
Plot 5
scores: no current data
| | data source: | sphere_ifs_dflat
(QC1 database) |
| dataset: | qc_rms | • |
| median: | 0.092024 | ADU |
| rel. thresholds: ±30% | 0.0644168...0.1196312 | ADU |
| N_data plotted: | 43 |
| [click on plot for closeup] |
Click on any of the plots to see a close-up version.
The latest date is indicated on top of the plot.
If configured,
- data points belonging to the latest date are specially marked
- statistical averages are indicated by a solid line, and thresholds by broken lines
- outliers are marked by a red asterisk. They are defined as data points outside the
threshold lines
- "aliens" (= data points outside the plot Y limits) are marked by a red arrow (↑ or ↓)
- you can download the data for each parameter set if the 'Data downloads' link shows up
|