[page auto-refreshes after 300 sec]   [stop | on]            [press Ctrl+Shift+R to enforce refresh of scores, dates and news]
SPHERE trending system: HEALTH CHECK report
HELP USERS-GUIDE MORE
Last update: 2017-10-25T22:40:32 (UT)
  | now: 2025-12-19T07:24:19 (UT) muc03n QC pipeline: spher-0.18.0 (installed 2016-03-17)
same group: med_master ron NumHotPix persistence   Background
close window history: 2014 2015 2016   2017   HEALTH
  ... ...
*Date on this monitor changes at 21:00 UT
Print: Information and research:
- png file - advanced studies: QC1 browser | QC1 plotter
Plot
?
Symb
?
Source
*
Average ? Thresholds ? N_
data
QC1
parameter
Data
downloads
Remarks
method value unit method value
1 QC1DB MEDIAN -0.05872 e-/ADU VAL1,4 13 qc_gain this | last_yr | all NonDest
2 QC1DB none   fractional none  0 qc_nonlin this | last_yr | all NonDest
3 QC1DB none   ADU none  13 qc_ron this | last_yr | all NonDest
4 QC1DB none   ADU none  13 qc_mincounts this | last_yr | all NonDest
4 QC1DB none   ADU none  13 qc_maxcounts this | last_yr | all NonDest
*Data sources: QC1DB: QC1 database; LOCAL: local data source
Plot 1
scores: not implemented
data source:sphere_ifs_gain
(QC1 database)
dataset:qc_gain
median:-0.05872e-/ADU
fixed thresholds:1...4e-/ADU
N_data plotted:13
[click on plot for closeup]
Plot 2
scores: not implemented
data source:sphere_ifs_gain
(QC1 database)
dataset:qc_nonlin
average:none
thresholds:none
N_data plotted:0
[click on plot for closeup]
Plot 3
scores: not implemented
data source:sphere_ifs_gain
(QC1 database)
dataset:qc_ron
average:none
thresholds:none
N_data plotted:13
[click on plot for closeup]
Plot 4
scores: not implemented
data source:sphere_ifs_gain
(QC1 database)
dataset:
(numbers below apply to this dataset)
qc_mincounts
average:none
thresholds:none
N_data plotted:13
[click on plot for closeup]
This plot

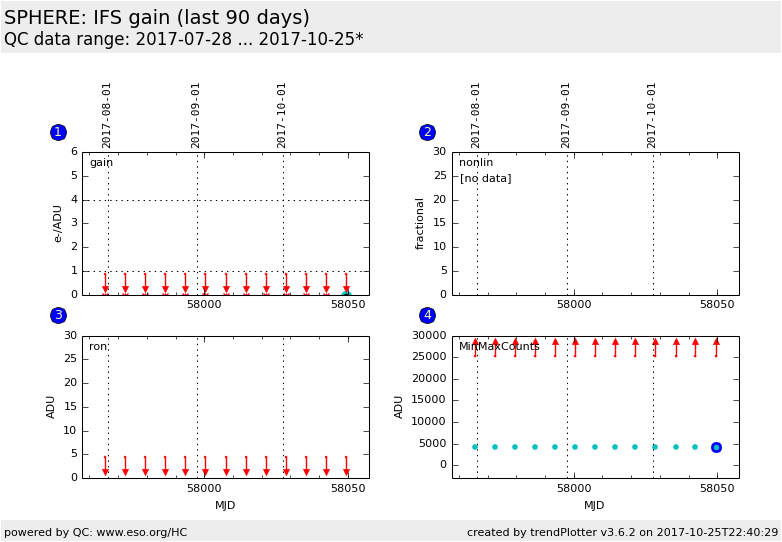
This plot monitors QC parameters RON and gain of the IFS-arm derived from the SPHERE_irdifs_detmon template and processed by the sph_isf_gain recipe.
2015-05-19: The nonlinearity is not yet provided by the recipe.
2015-05-20: The template does not open the shutter (all IFS_GAIN data are currently useless)


General information

Click on any of the plots to see a close-up version.

The latest date is indicated on top of the plot.

If configured,

  • data points belonging to the latest date are specially marked
  • statistical averages are indicated by a solid line, and thresholds by broken lines
  • outliers are marked by a red asterisk. They are defined as data points outside the threshold lines
  • "aliens" (= data points outside the plot Y limits) are marked by a red arrow ( or )
  • you can download the data for each parameter set if the 'Data downloads' link shows up