|
|
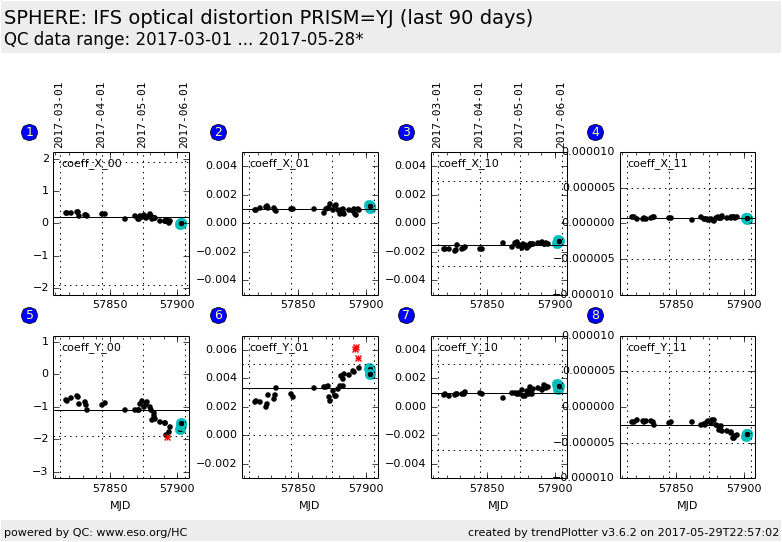
| SPHERE trending system: HEALTH CHECK report |
|
|
| Last update: 2017-05-29T22:57:11 (UT)
|
|
|
|
|
|
|
*Date on this monitor changes at 21:00 UT |
|

|
|
|
Plot
? |
Symb
? |
Source
* |
Average ? |
Thresholds ? |
N_
data |
QC1
parameter |
Data
downloads |
Remarks |
| method |
value |
unit |
method |
value |
| 1 |
• | QC1DB |
MEDIAN |
0.184834 |
NONE |
VAL | -1.9,1.9 |
36 |
qc_dist_x_0_0 |
this |
last_yr |
all
|
optical distortion polynomial coefficients |
| 2 |
• | QC1DB |
MEDIAN |
0.00101402 |
NONE |
VAL | 0,0.005 |
36 |
qc_dist_x_0_1 |
this |
last_yr |
all
|
optical distortion polynomial coefficients |
| 3 |
• | QC1DB |
MEDIAN |
-0.00149088 |
NONE |
VAL | -0.003,0.003 |
36 |
qc_dist_x_1_0 |
this |
last_yr |
all
|
optical distortion polynomial coefficients |
| 4 |
• | QC1DB |
MEDIAN |
7.65715e-07 |
NONE |
VAL | -0.000005,0.000005 |
36 |
qc_dist_x_1_1 |
this |
last_yr |
all
|
optical distortion polynomial coefficients |
| 5 |
• | QC1DB |
MEDIAN |
-1.09448 |
NONE |
VAL | -1.9,1.9 |
36 |
qc_dist_y_0_0 |
this |
last_yr |
all
|
optical distortion polynomial coefficients |
| 6 |
• | QC1DB |
MEDIAN |
0.00335577 |
NONE |
VAL | 0,0.005 |
36 |
qc_dist_y_0_1 |
this |
last_yr |
all
|
optical distortion polynomial coefficients |
| 7 |
• | QC1DB |
MEDIAN |
0.00098186 |
NONE |
VAL | -0.003,0.003 |
36 |
qc_dist_y_1_0 |
this |
last_yr |
all
|
optical distortion polynomial coefficients |
| 8 |
• | QC1DB |
MEDIAN |
-2.53127e-06 |
NONE |
VAL | -0.000005,0.000005 |
36 |
qc_dist_y_1_1 |
this |
last_yr |
all
|
optical distortion polynomial coefficients |
| |
|
*Data sources: QC1DB: QC1 database; LOCAL: local data source
|
Plot 1
scores: no current data
| | data source: | sphere_ifs_specpos
(QC1 database) |
| dataset: | qc_dist_x_0_0 | • |
| median: | 0.184834 | NONE |
| fixed thresholds: | -1.9...1.9 | NONE |
| N_data plotted: | 36 |
| [click on plot for closeup] |
Plot 2
scores: no current data
| | data source: | sphere_ifs_specpos
(QC1 database) |
| dataset: | qc_dist_x_0_1 | • |
| median: | 0.00101402 | NONE |
| fixed thresholds: | 0...0.005 | NONE |
| N_data plotted: | 36 |
| [click on plot for closeup] |
Plot 3
scores: no current data
| | data source: | sphere_ifs_specpos
(QC1 database) |
| dataset: | qc_dist_x_1_0 | • |
| median: | -0.00149088 | NONE |
| fixed thresholds: | -0.003...0.003 | NONE |
| N_data plotted: | 36 |
| [click on plot for closeup] |
Plot 4
scores: no current data
| | data source: | sphere_ifs_specpos
(QC1 database) |
| dataset: | qc_dist_x_1_1 | • |
| median: | 7.65715e-07 | NONE |
| fixed thresholds: | -5e-06...5e-06 | NONE |
| N_data plotted: | 36 |
| [click on plot for closeup] |
Plot 5
scores: no current data
| | data source: | sphere_ifs_specpos
(QC1 database) |
| dataset: | qc_dist_y_0_0 | • |
| median: | -1.09448 | NONE |
| fixed thresholds: | -1.9...1.9 | NONE |
| N_data plotted: | 36 |
| [click on plot for closeup] |
Plot 6
scores: no current data
| | data source: | sphere_ifs_specpos
(QC1 database) |
| dataset: | qc_dist_y_0_1 | • |
| median: | 0.00335577 | NONE |
| fixed thresholds: | 0...0.005 | NONE |
| N_data plotted: | 36 |
| [click on plot for closeup] |
Plot 7
scores: no current data
| | data source: | sphere_ifs_specpos
(QC1 database) |
| dataset: | qc_dist_y_1_0 | • |
| median: | 0.00098186 | NONE |
| fixed thresholds: | -0.003...0.003 | NONE |
| N_data plotted: | 36 |
| [click on plot for closeup] |
Plot 8
scores: no current data
| | data source: | sphere_ifs_specpos
(QC1 database) |
| dataset: | qc_dist_y_1_1 | • |
| median: | -2.53127e-06 | NONE |
| fixed thresholds: | -5e-06...5e-06 | NONE |
| N_data plotted: | 36 |
| [click on plot for closeup] |
This plot shows the polynomial coefficients that describes the difference
between measured spectra centers and the expected spectra centers.
General information
Click on any of the plots to see a close-up version.
The latest date is indicated on top of the plot.
If configured,
- data points belonging to the latest date are specially marked
- statistical averages are indicated by a solid line, and thresholds by broken lines
- outliers are marked by a red asterisk. They are defined as data points outside the
threshold lines
- "aliens" (= data points outside the plot Y limits) are marked by a red arrow (↑ or ↓)
- you can download the data for each parameter set if the 'Data downloads' link shows up
|