Plot
? |
Symb
? |
Source
* |
Average ? |
Thresholds ? |
N_
data |
QC1
parameter |
Data
downloads |
Remarks |
| method |
value |
unit |
method |
value |
| 1 |
• | QC1DB |
MEDIAN |
|
pixel |
VAL | 400,600 |
0 |
qc_optaxis_x |
this |
last_yr |
all
|
Y-band left beam |
| 2 |
• | QC1DB |
MEDIAN |
|
pixel |
VAL | 400,600 |
0 |
qc_optaxis_x |
this |
last_yr |
all
|
Y-band right beam |
| 3 |
• | QC1DB |
MEDIAN |
|
pixel |
VAL | 400,600 |
0 |
qc_optaxis_x |
this |
last_yr |
all
|
J-band left beam |
| 4 |
• | QC1DB |
MEDIAN |
|
pixel |
VAL | 400,600 |
0 |
qc_optaxis_x |
this |
last_yr |
all
|
J-band right beam |
| 5 |
• | QC1DB |
MEDIAN |
490.652 |
pixel |
VAL | 400,600 |
6 |
qc_optaxis_x |
this |
last_yr |
all
|
H-band left beam |
| 6 |
• | QC1DB |
MEDIAN |
493.805 |
pixel |
VAL | 400,600 |
6 |
qc_optaxis_x |
this |
last_yr |
all
|
H-band right beam |
| 7 |
• | QC1DB |
MEDIAN |
|
pixel |
VAL | 400,600 |
0 |
qc_optaxis_x |
this |
last_yr |
all
|
K-band left beam |
| 8 |
• | QC1DB |
MEDIAN |
|
pixel |
VAL | 400,600 |
0 |
qc_optaxis_x |
this |
last_yr |
all
|
K-band right beam |
| |
|
*Data sources: QC1DB: QC1 database; LOCAL: local data source
|
Plot 1
scores: no current data
| | data source: | sphere_irdis_distmap
(QC1 database) |
| dataset: | qc_optaxis_x | • |
| median: | no data | pixel |
| fixed thresholds: | 400...600 | pixel |
| N_data plotted: | 0 |
| [click on plot for closeup] |
Plot 2
scores: no current data
| | data source: | sphere_irdis_distmap
(QC1 database) |
| dataset: | qc_optaxis_x | • |
| median: | no data | pixel |
| fixed thresholds: | 400...600 | pixel |
| N_data plotted: | 0 |
| [click on plot for closeup] |
Plot 3
scores: no current data
| | data source: | sphere_irdis_distmap
(QC1 database) |
| dataset: | qc_optaxis_x | • |
| median: | no data | pixel |
| fixed thresholds: | 400...600 | pixel |
| N_data plotted: | 0 |
| [click on plot for closeup] |
Plot 4
scores: no current data
| | data source: | sphere_irdis_distmap
(QC1 database) |
| dataset: | qc_optaxis_x | • |
| median: | no data | pixel |
| fixed thresholds: | 400...600 | pixel |
| N_data plotted: | 0 |
| [click on plot for closeup] |
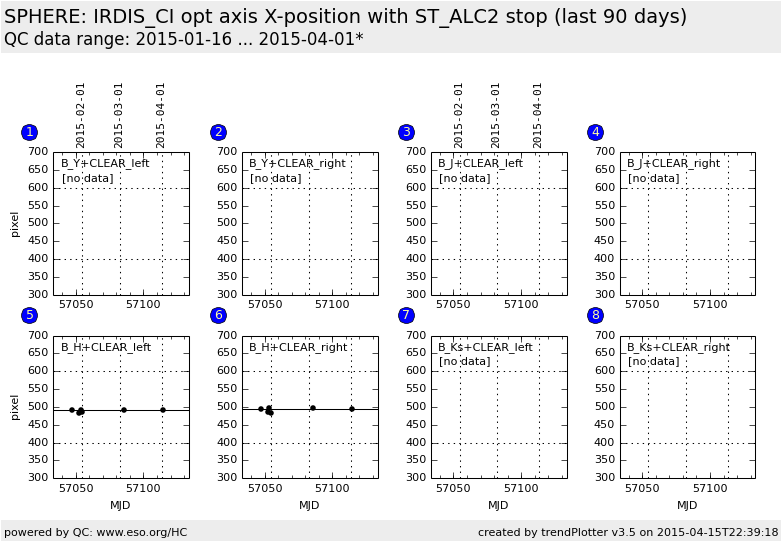
Plot 5
scores:  1| 1|
| | data source: | sphere_irdis_distmap
(QC1 database) |
| dataset: | qc_optaxis_x | • |
| median: | 490.652 | pixel |
| fixed thresholds: | 400...600 | pixel |
| N_data plotted: | 6 |
| [click on plot for closeup] |
Plot 6
scores: 1|
| | data source: | sphere_irdis_distmap
(QC1 database) |
| dataset: | qc_optaxis_x | • |
| median: | 493.805 | pixel |
| fixed thresholds: | 400...600 | pixel |
| N_data plotted: | 6 |
| [click on plot for closeup] |
Plot 7
scores: no current data
| | data source: | sphere_irdis_distmap
(QC1 database) |
| dataset: | qc_optaxis_x | • |
| median: | no data | pixel |
| fixed thresholds: | 400...600 | pixel |
| N_data plotted: | 0 |
| [click on plot for closeup] |
Plot 8
scores: no current data
| | data source: | sphere_irdis_distmap
(QC1 database) |
| dataset: | qc_optaxis_x | • |
| median: | no data | pixel |
| fixed thresholds: | 400...600 | pixel |
| N_data plotted: | 0 |
| [click on plot for closeup] |
This plot shows the x-position of the optical axis derived from the
irdis distortion recipe. The ST_ALC2 stop is in the optical path.
Optical axis x-positions of the right beam refer to the right beam product
extension with
size 1024x1024 pixel covering the pixel area x=[1025,2048], y=[1,1024]
of the raw frame.
This plot is provisional, as the irdis distortion recipe is not yet fully operational.
General information
Click on any of the plots to see a close-up version.
The latest date is indicated on top of the plot.
If configured,
- data points belonging to the latest date are specially marked
- statistical averages are indicated by a solid line, and thresholds by broken lines
- outliers are marked by a red asterisk. They are defined as data points outside the
threshold lines
- "aliens" (= data points outside the plot Y limits) are marked by a red arrow (↑ or ↓)
- you can download the data for each parameter set if the 'Data downloads' link shows up
|
