SPHERE trending system: HEALTH CHECK report
Last update: 2016-06-09T22:36:42 (UT)
[enable javascript for displaying time difference!]
*Date on this monitor changes at 21:00 UT
Plot? Symb? Source Average ? Thresholds ? N_ QC1 Data Remarks
method value unit method value
1
• QC1DB MEDIAN 2996.56 ADU VAL 1000,12000 3 qc_adu_left_0
this |
last_yr |
all
Y-band left beam
2
• QC1DB MEDIAN 2981.4 ADU VAL 1000,12000 3 qc_adu_right_0
this |
last_yr |
all
Y-band right beam
3
• QC1DB MEDIAN 3487.09 ADU VAL 1000,12000 11 qc_adu_left_0
this |
last_yr |
all
J-band left beam
4
• QC1DB MEDIAN 3654.51 ADU VAL 1000,12000 11 qc_adu_right_0
this |
last_yr |
all
J-band right beam
5
• QC1DB MEDIAN 3961.68 ADU VAL 1000,12000 45 qc_adu_left_0
this |
last_yr |
all
H-band left beam
6
• QC1DB MEDIAN 3859.45 ADU VAL 1000,12000 45 qc_adu_right_0
this |
last_yr |
all
H-band right beam
7
• QC1DB MEDIAN 1870.03 ADU VAL 1000,12000 11 qc_adu_left_0
this |
last_yr |
all
K-band left beam
8
• QC1DB MEDIAN 1722.23 ADU VAL 1000,12000 11 qc_adu_right_0
this |
last_yr |
all
K-band right beam
*Data sources: QC1DB: QC1 database; LOCAL: local data source
Plot 1 scores: no current data
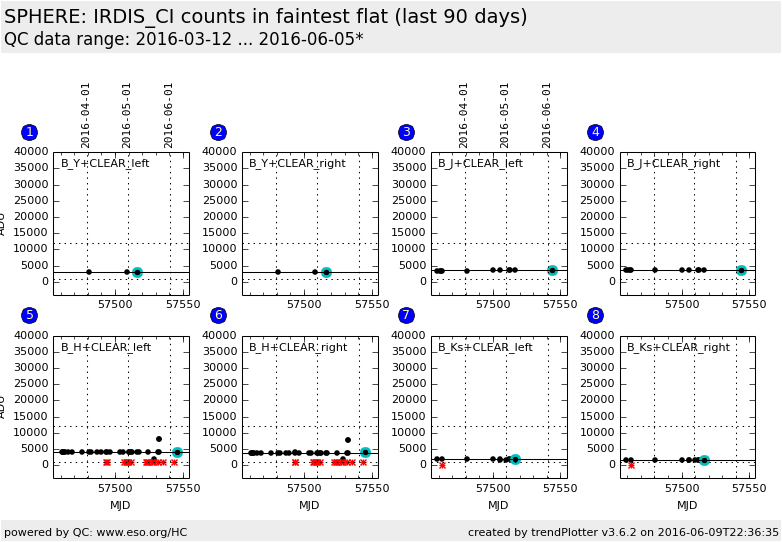
data source: sphere_irdis_flat dataset: qc_adu_left_0 • median: 2996.56 ADU fixed thresholds: 1000...12000 ADU N_data plotted: 3 [click on plot for closeup]
Plot 2 scores: no current data
data source: sphere_irdis_flat dataset: qc_adu_right_0 • median: 2981.4 ADU fixed thresholds: 1000...12000 ADU N_data plotted: 3 [click on plot for closeup]
Plot 3 scores: no current data
data source: sphere_irdis_flat dataset: qc_adu_left_0 • median: 3487.09 ADU fixed thresholds: 1000...12000 ADU N_data plotted: 11 [click on plot for closeup]
Plot 4 scores: no current data
data source: sphere_irdis_flat dataset: qc_adu_right_0 • median: 3654.51 ADU fixed thresholds: 1000...12000 ADU N_data plotted: 11 [click on plot for closeup]
Plot 5 scores: no current data
data source: sphere_irdis_flat dataset: qc_adu_left_0 • median: 3961.68 ADU fixed thresholds: 1000...12000 ADU N_data plotted: 45 [click on plot for closeup]
Plot 6 scores: no current data
data source: sphere_irdis_flat dataset: qc_adu_right_0 • median: 3859.45 ADU fixed thresholds: 1000...12000 ADU N_data plotted: 45 [click on plot for closeup]
Plot 7 scores: no current data
data source: sphere_irdis_flat dataset: qc_adu_left_0 • median: 1870.03 ADU fixed thresholds: 1000...12000 ADU N_data plotted: 11 [click on plot for closeup]
Plot 8 scores: no current data
data source: sphere_irdis_flat dataset: qc_adu_right_0 • median: 1722.23 ADU fixed thresholds: 1000...12000 ADU N_data plotted: 11 [click on plot for closeup]
This plot
This plot shows the median counts in the lowest of two raw input flats.
The QC parameter is monitored for the left and the right beam
and for the four broad band filters in the common filter wheel: B_Y, B_H, B_J and B_K,
separately. The dual beam filter wheel is 'CLEAR' in classical imaging mode.
General information
Click on any of the plots to see a close-up version .
The latest date is indicated on top of the plot.
If configured,
data points belonging to the latest date are specially marked statistical averages are indicated by a solid line, and thresholds by broken lines outliers are marked by a red asterisk. They are defined as data points outside the
threshold lines "aliens" (= data points outside the plot Y limits) are marked by a red arrow (↑ ↓ you can download the data for each parameter set if the 'Data downloads' link shows up
