Plot
? |
Symb
? |
Source
* |
Average ? |
Thresholds ? |
N_
data |
QC1
parameter |
Data
downloads |
Remarks |
| method |
value |
unit |
method |
value |
| 1 |
• | QC1DB |
none |
|
MAG |
none | |
0 |
qc_zpoint1_corrND |
this |
last_yr |
all
|
J-band, left beam, ND_3.5 |
| 1 |
• | QC1DB |
none |
|
MAG |
none | |
7 |
qc_zpoint1_corrND |
this |
last_yr |
all
|
J-band, left beam, ND_2.0 |
| 2 |
• | QC1DB |
none |
|
MAG |
none | |
7 |
qc_zpoint1_corrND |
this |
last_yr |
all
|
H-band, left beam, ND_3.5 |
| 2 |
• | QC1DB |
none |
|
MAG |
none | |
0 |
qc_zpoint1_corrND |
this |
last_yr |
all
|
H-band, left beam, ND_2.0 |
| 3 |
• | QC1DB |
none |
|
MAG |
none | |
5 |
qc_zpoint1_corrND |
this |
last_yr |
all
|
K-band, left beam, ND_3.5 |
| 3 |
• | QC1DB |
none |
|
MAG |
none | |
2 |
qc_zpoint1_corrND |
this |
last_yr |
all
|
K-band, left beam, ND_2.0 |
| 4 |
• | QC1DB |
none |
|
MAG |
none | |
0 |
qc_zpoint2_corrND |
this |
last_yr |
all
|
J-band, right beam, ND_3.5 |
| 4 |
• | QC1DB |
none |
|
MAG |
none | |
7 |
qc_zpoint2_corrND |
this |
last_yr |
all
|
J-band, right beam, ND_2.0 |
| 5 |
• | QC1DB |
none |
|
MAG |
none | |
7 |
qc_zpoint2_corrND |
this |
last_yr |
all
|
H-band, right beam, ND_3.5 |
| 5 |
• | QC1DB |
none |
|
MAG |
none | |
0 |
qc_zpoint2_corrND |
this |
last_yr |
all
|
H-band, right beam, ND_2.0 |
| 6 |
• | QC1DB |
none |
|
MAG |
none | |
5 |
qc_zpoint2_corrND |
this |
last_yr |
all
|
K-band, right beam, ND_3.5 |
| 6 |
• | QC1DB |
none |
|
MAG |
none | |
2 |
qc_zpoint2_corrND |
this |
last_yr |
all
|
K-band, right beam, ND_2.0 |
| |
|
*Data sources: QC1DB: QC1 database; LOCAL: local data source
|
Plot 1
scores: not implemented
| | data source: | sphere_irdis_photstd
(QC1 database) |
dataset:
(numbers below apply to this dataset) | qc_zpoint1_corrND | • |
| average: | none |
| thresholds: | none |
| N_data plotted: | 0 |
| [click plot for closeup] |
Plot 2
scores: not implemented
| | data source: | sphere_irdis_photstd
(QC1 database) |
dataset:
(numbers below apply to this dataset) | qc_zpoint1_corrND | • |
| average: | none |
| thresholds: | none |
| N_data plotted: | 7 |
| [click plot for closeup] |
Plot 3
scores: not implemented
| | data source: | sphere_irdis_photstd
(QC1 database) |
dataset:
(numbers below apply to this dataset) | qc_zpoint1_corrND | • |
| average: | none |
| thresholds: | none |
| N_data plotted: | 5 |
| [click plot for closeup] |
Plot 4
scores: not implemented
| | data source: | sphere_irdis_photstd
(QC1 database) |
dataset:
(numbers below apply to this dataset) | qc_zpoint2_corrND | • |
| average: | none |
| thresholds: | none |
| N_data plotted: | 0 |
| [click plot for closeup] |
Plot 5
scores: not implemented
| | data source: | sphere_irdis_photstd
(QC1 database) |
dataset:
(numbers below apply to this dataset) | qc_zpoint2_corrND | • |
| average: | none |
| thresholds: | none |
| N_data plotted: | 7 |
| [click plot for closeup] |
Plot 6
scores: not implemented
| | data source: | sphere_irdis_photstd
(QC1 database) |
dataset:
(numbers below apply to this dataset) | qc_zpoint2_corrND | • |
| average: | none |
| thresholds: | none |
| N_data plotted: | 5 |
| [click plot for closeup] |
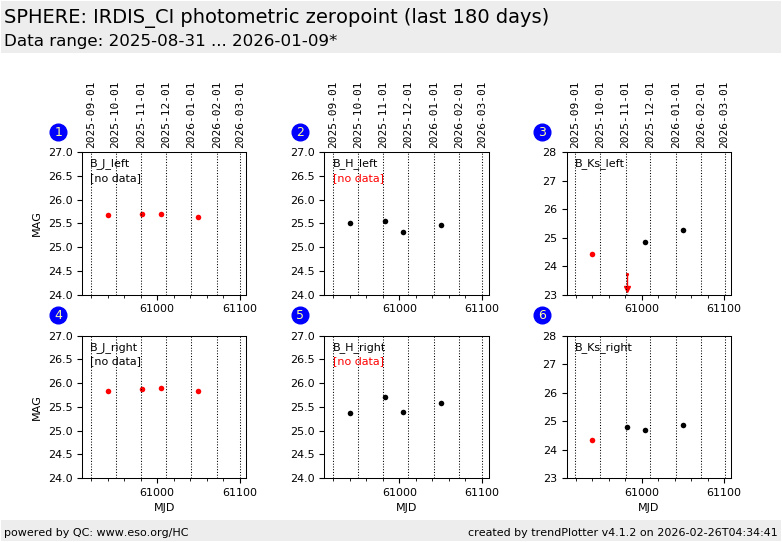
This plot shows the IRDIS photometric zeropoints.
Photometric standard stars are acquired since start of operations
(2015-04) every 30 days as part of the IRDIS calibration plan in CI mode
in four broad band filters Y, J, H and K. Further setup parameters are
the CPI neutral density filter, the AO loop status and the wavefront sensor
spatial filter. Only closed loop observations are shown in this plot. Open loop observational results are available in the QC1 database.
Photometric zeropoints are calculated by the IRDIS pipeline recipe since 2017-11.
The catalogue in use does not contain Y-band magnitudes.
No airmass dependent extinction correction is applied.
The neutral density filter correction is applied.
General information
Click on any of the plots to see a close-up version.
The latest date is indicated on top of the plot.
If configured,
- data points belonging to the latest date are specially marked
- statistical averages are indicated by a solid line, and thresholds by broken lines
- outliers are marked by a red asterisk. They are defined as data points outside the
threshold lines
- "aliens" (= data points outside the plot Y limits) are marked by a red arrow (↑ or ↓)
- you can download the data for each parameter set if the 'Data downloads' link shows up
|
