|
|
| SPHERE trending system: HEALTH CHECK report |
|
|
| Last update: 2017-10-25T22:35:48 (UT)
|
|
|
|
|
|
|
*Date on this monitor changes at 21:00 UT |
|

|
|
|
Plot
? |
Symb
? |
Source
* |
Average ? |
Thresholds ? |
N_
data |
QC1
parameter |
Data
downloads |
Remarks |
| method |
value |
unit |
method |
value |
| 1 |
• | QC1DB |
MEDIAN |
7.69403 |
e-/ADU |
none | |
13 |
qc_gain |
this |
last_yr |
all
|
gain in e-/ADU |
| 2 |
• | QC1DB |
MEDIAN |
40559.1 |
ADU |
none | |
13 |
qc_maxcounts |
this |
last_yr |
all
|
counts in highest illuminated flat |
| |
|
*Data sources: QC1DB: QC1 database; LOCAL: local data source
|
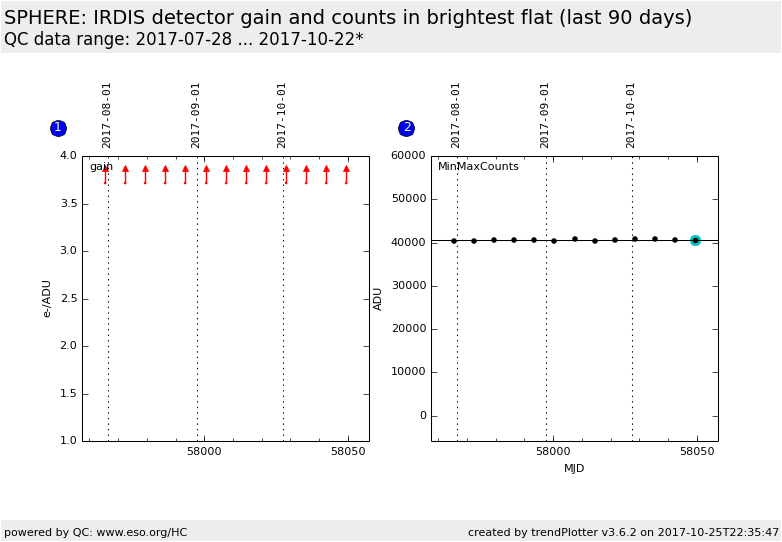
Plot 1
scores: no current data
| | data source: | sphere_irdis_gain
(QC1 database) |
| dataset: | qc_gain | • |
| median: | 7.69403 | e-/ADU |
| thresholds: | none | |
| N_data plotted: | 13 |
| [click on plot for closeup] |
Plot 2
scores: not implemented
| | data source: | sphere_irdis_gain
(QC1 database) |
| dataset: | qc_maxcounts | • |
| median: | 40559.1 | ADU |
| thresholds: | none | |
| N_data plotted: | 13 |
| [click on plot for closeup] |
This plot shows the IRDIS detector gain and the median counts in the highest illuminated flat of the
raw frame sequence of the gain template.
General information
Click on any of the plots to see a close-up version.
The latest date is indicated on top of the plot.
If configured,
- data points belonging to the latest date are specially marked
- statistical averages are indicated by a solid line, and thresholds by broken lines
- outliers are marked by a red asterisk. They are defined as data points outside the
threshold lines
- "aliens" (= data points outside the plot Y limits) are marked by a red arrow (↑ or ↓)
- you can download the data for each parameter set if the 'Data downloads' link shows up
|