|
|
| SPHERE trending system: HEALTH CHECK report |
|
|
| Last update: 2015-05-19T09:53:53 (UT)
|
|
|
[an error occurred while processing this directive]

|
|
|
Plot
? |
Symb
? |
Source
* |
Average ? |
Thresholds ? |
N_
data |
QC1
parameter |
Data
downloads |
Remarks |
| method |
value |
unit |
method |
value |
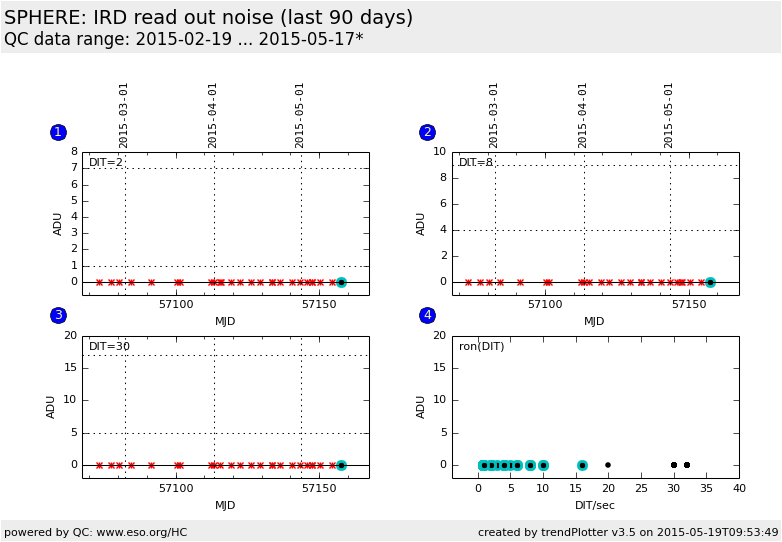
| 1 |
• | QC1DB |
MEDIAN |
0 |
ADU |
VAL | 1,7 |
26 |
qc_ron |
this |
last_yr |
all
|
DIT=2, NDIT=40, Nondest |
| 2 |
• | QC1DB |
MEDIAN |
0 |
ADU |
VAL | 4,9 |
25 |
qc_ron |
this |
last_yr |
all
|
DIT=8, NDIT=25, Nondest |
| 3 |
• | QC1DB |
MEDIAN |
0 |
ADU |
VAL | 5,17 |
25 |
qc_ron |
this |
last_yr |
all
|
DIT=30, NDIT=15, Nondest |
| 4 |
• | QC1DB |
none |
|
NONE |
none | |
880 |
qc_ron |
this |
last_yr |
all
|
ron as function of DIT |
| |
|
*Data sources: QC1DB: QC1 database; LOCAL: local data source
|
Plot 1
scores: no current data
| | data source: | sphere_irdis_dark
(QC1 database) |
| dataset: | qc_ron | • |
| median: | 0 | ADU |
| fixed thresholds: | 1...7 | ADU |
| N_data plotted: | 26 |
| [click on plot for closeup] |
Plot 2
scores: no current data
| | data source: | sphere_irdis_dark
(QC1 database) |
| dataset: | qc_ron | • |
| median: | 0 | ADU |
| fixed thresholds: | 4...9 | ADU |
| N_data plotted: | 25 |
| [click on plot for closeup] |
Plot 3
scores: no current data
| | data source: | sphere_irdis_dark
(QC1 database) |
| dataset: | qc_ron | • |
| median: | 0 | ADU |
| fixed thresholds: | 5...17 | ADU |
| N_data plotted: | 25 |
| [click on plot for closeup] |
Plot 4
scores: not implemented
| | data source: | sphere_irdis_dark
(QC1 database) |
| dataset: | qc_ron | • |
| average: | none |
| thresholds: | none |
| N_data plotted: | 880 |
| [click on plot for closeup] |
Click on any of the plots to see a close-up version.
The latest date is indicated on top of the plot.
If configured,
- data points belonging to the latest date are specially marked
- statistical averages are indicated by a solid line, and thresholds by broken lines
- outliers are marked by a red asterisk. They are defined as data points outside the
threshold lines
- "aliens" (= data points outside the plot Y limits) are marked by a red arrow (↑ or ↓)
- you can download the data for each parameter set if the 'Data downloads' link shows up
|
|