Plot
? |
Symb
? |
Source
* |
Average ? |
Thresholds ? |
N_
data |
QC1
parameter |
Data
downloads |
Remarks |
| method |
value |
unit |
method |
value |
| 1 |
• | QC1DB |
none |
|
degree |
none | |
2 |
qc_THETA_offset |
this |
last_yr |
all
|
V-band, chip 1, polhigh |
| 2 |
• | QC1DB |
none |
|
degree |
none | |
2 |
qc_THETA_offset |
this |
last_yr |
all
|
R-band, chip 1, polhigh |
| 3 |
• | QC1DB |
none |
|
degree |
none | |
2 |
qc_THETA_offset |
this |
last_yr |
all
|
I-band, chip 1, polhigh |
| 4 |
• | QC1DB |
none |
|
degree |
none | |
2 |
qc_THETA_offset |
this |
last_yr |
all
|
V-band, chip 2, polhigh |
| 5 |
• | QC1DB |
none |
|
degree |
none | |
2 |
qc_THETA_offset |
this |
last_yr |
all
|
R-band, chip 2, polhigh |
| 6 |
• | QC1DB |
none |
|
degree |
none | |
2 |
qc_THETA_offset |
this |
last_yr |
all
|
I-band, chip 2, polhigh |
| |
|
*Data sources: QC1DB: QC1 database; LOCAL: local data source
|
Plot 1
scores: not implemented
| | data source: | sphere_zimpol_stdpol_pol
(QC1 database) |
| dataset: | qc_THETA_offset | • |
| average: | none |
| thresholds: | none |
| N_data plotted: | 2 |
| [click plot for closeup] |
Plot 2
scores: not implemented
| | data source: | sphere_zimpol_stdpol_pol
(QC1 database) |
| dataset: | qc_THETA_offset | • |
| average: | none |
| thresholds: | none |
| N_data plotted: | 2 |
| [click plot for closeup] |
Plot 3
scores: not implemented
| | data source: | sphere_zimpol_stdpol_pol
(QC1 database) |
| dataset: | qc_THETA_offset | • |
| average: | none |
| thresholds: | none |
| N_data plotted: | 2 |
| [click plot for closeup] |
Plot 4
scores: not implemented
| | data source: | sphere_zimpol_stdpol_pol
(QC1 database) |
| dataset: | qc_THETA_offset | • |
| average: | none |
| thresholds: | none |
| N_data plotted: | 2 |
| [click plot for closeup] |
Plot 5
scores: not implemented
| | data source: | sphere_zimpol_stdpol_pol
(QC1 database) |
| dataset: | qc_THETA_offset | • |
| average: | none |
| thresholds: | none |
| N_data plotted: | 2 |
| [click plot for closeup] |
Plot 6
scores: not implemented
| | data source: | sphere_zimpol_stdpol_pol
(QC1 database) |
| dataset: | qc_THETA_offset | • |
| average: | none |
| thresholds: | none |
| N_data plotted: | 2 |
| [click plot for closeup] |
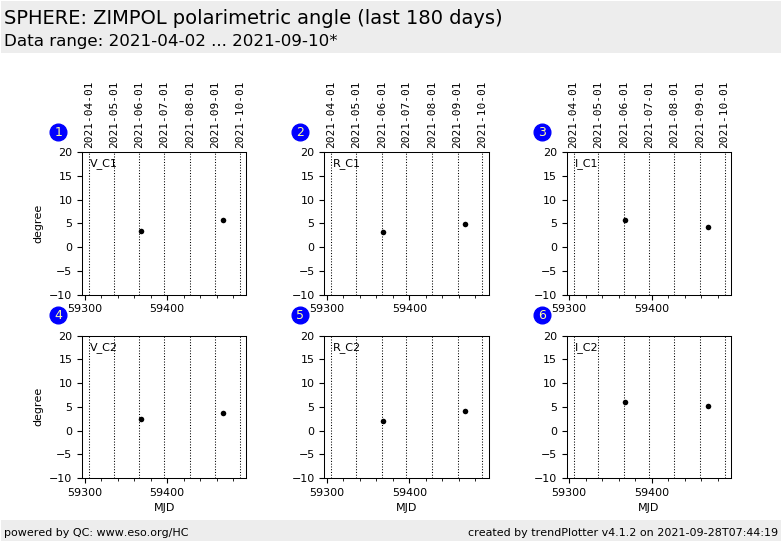
This plot shows the measured angle of highest polarimetry (P_THETA) of the high polarimetric standard star minus the
tabulated angle: qc_THETA_offset. Only V-band values are tabulated for the high polarized standard stars.
Trending plots for the R and I band assume that the real (but not tabulated) R and I band polarimetric values are those of the V band.
Not all polarimetric standard stars of the catalogue have an entry for the angle.
All values are given in degrees.
For the non-polarized standard stars, the angle is not defined.
General information
Click on any of the plots to see a close-up version.
The latest date is indicated on top of the plot.
If configured,
- data points belonging to the latest date are specially marked
- statistical averages are indicated by a solid line, and thresholds by broken lines
- outliers are marked by a red asterisk. They are defined as data points outside the
threshold lines
- "aliens" (= data points outside the plot Y limits) are marked by a red arrow (↑ or ↓)
- you can download the data for each parameter set if the 'Data downloads' link shows up
|
