|
|
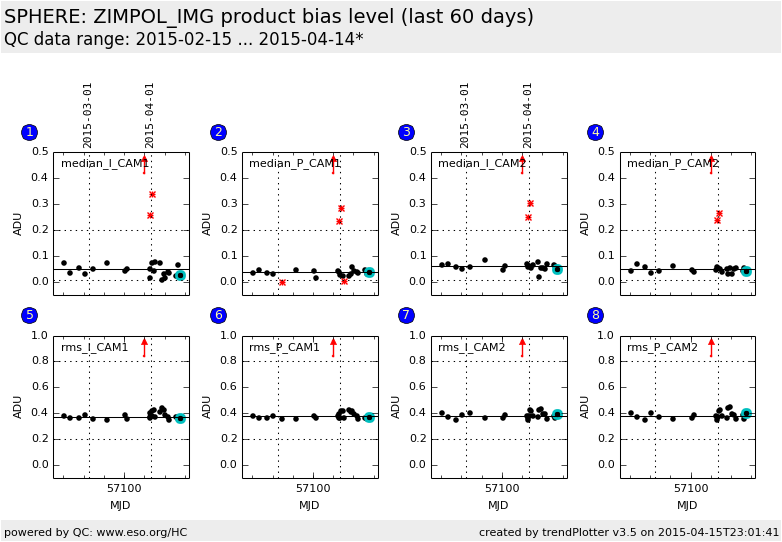
| SPHERE trending system: HEALTH CHECK report |
|
|
| Last update: 2015-04-15T23:01:50 (UT)
|
|
|
|
|
|
|
*Date on this monitor changes at 21:00 UT |
|

|
|
|
Plot
? |
Symb
? |
Source
* |
Average ? |
Thresholds ? |
N_
data |
QC1
parameter |
Data
downloads |
Remarks |
| method |
value |
unit |
method |
value |
| 1 |
• | QC1DB |
MEDIAN |
0.047955 |
ADU |
VAL | 0.005,0.2 |
25 |
qc_median_iframe |
this |
last_yr |
all
|
imaging channel |
| 2 |
• | QC1DB |
MEDIAN |
0.039147 |
ADU |
VAL | 0.005,0.2 |
25 |
qc_median_pframe |
this |
last_yr |
all
|
unused polarimetry channel |
| 3 |
• | QC1DB |
MEDIAN |
0.06204 |
ADU |
VAL | 0.005,0.2 |
25 |
qc_median_iframe |
this |
last_yr |
all
|
imaging channel |
| 4 |
• | QC1DB |
MEDIAN |
0.049094 |
ADU |
VAL | 0.005,0.2 |
25 |
qc_median_pframe |
this |
last_yr |
all
|
unused polarimetry channel |
| 5 |
• | QC1DB |
MEDIAN |
0.37335 |
ADU |
VAL | 0.2,0.8 |
25 |
qc_rms_iframe |
this |
last_yr |
all
|
imaging channel |
| 6 |
• | QC1DB |
MEDIAN |
0.376489 |
ADU |
VAL | 0.2,0.8 |
25 |
qc_rms_pframe |
this |
last_yr |
all
|
unused polarimetry channel |
| 7 |
• | QC1DB |
MEDIAN |
0.381607 |
ADU |
VAL | 0.2,0.8 |
25 |
qc_rms_iframe |
this |
last_yr |
all
|
imaging channel |
| 8 |
• | QC1DB |
MEDIAN |
0.382238 |
ADU |
VAL | 0.2,0.8 |
25 |
qc_rms_pframe |
this |
last_yr |
all
|
unused polarimetry channel |
| |
|
*Data sources: QC1DB: QC1 database; LOCAL: local data source
|
Plot 1
scores: not implemented
| | data source: | sphere_zimpol_bias_img
(QC1 database) |
| dataset: | qc_median_iframe | • |
| median: | 0.047955 | ADU |
| fixed thresholds: | 0.005...0.2 | ADU |
| N_data plotted: | 25 |
| [click on plot for closeup] |
Plot 2
scores: not implemented
| | data source: | sphere_zimpol_bias_img
(QC1 database) |
| dataset: | qc_median_pframe | • |
| median: | 0.039147 | ADU |
| fixed thresholds: | 0.005...0.2 | ADU |
| N_data plotted: | 25 |
| [click on plot for closeup] |
Plot 3
scores: not implemented
| | data source: | sphere_zimpol_bias_img
(QC1 database) |
| dataset: | qc_median_iframe | • |
| median: | 0.06204 | ADU |
| fixed thresholds: | 0.005...0.2 | ADU |
| N_data plotted: | 25 |
| [click on plot for closeup] |
Plot 4
scores: not implemented
| | data source: | sphere_zimpol_bias_img
(QC1 database) |
| dataset: | qc_median_pframe | • |
| median: | 0.049094 | ADU |
| fixed thresholds: | 0.005...0.2 | ADU |
| N_data plotted: | 25 |
| [click on plot for closeup] |
Plot 5
scores:  5| 5|
| | data source: | sphere_zimpol_bias_img
(QC1 database) |
| dataset: | qc_rms_iframe | • |
| median: | 0.37335 | ADU |
| fixed thresholds: | 0.2...0.8 | ADU |
| N_data plotted: | 25 |
| [click on plot for closeup] |
Plot 6
scores: 5|
| | data source: | sphere_zimpol_bias_img
(QC1 database) |
| dataset: | qc_rms_pframe | • |
| median: | 0.376489 | ADU |
| fixed thresholds: | 0.2...0.8 | ADU |
| N_data plotted: | 25 |
| [click on plot for closeup] |
Plot 7
scores: 5|
| | data source: | sphere_zimpol_bias_img
(QC1 database) |
| dataset: | qc_rms_iframe | • |
| median: | 0.381607 | ADU |
| fixed thresholds: | 0.2...0.8 | ADU |
| N_data plotted: | 25 |
| [click on plot for closeup] |
Plot 8
scores: 5|
| | data source: | sphere_zimpol_bias_img
(QC1 database) |
| dataset: | qc_rms_pframe | • |
| median: | 0.382238 | ADU |
| fixed thresholds: | 0.2...0.8 | ADU |
| N_data plotted: | 25 |
| [click on plot for closeup] |
Click on any of the plots to see a close-up version.
The latest date is indicated on top of the plot.
If configured,
- data points belonging to the latest date are specially marked
- statistical averages are indicated by a solid line, and thresholds by broken lines
- outliers are marked by a red asterisk. They are defined as data points outside the
threshold lines
- "aliens" (= data points outside the plot Y limits) are marked by a red arrow (↑ or ↓)
- you can download the data for each parameter set if the 'Data downloads' link shows up
|
|