UVES: Cross Dispersers
| |
| HC PLOTS |
| mean Y value |
 |
| rms Y value |
|
|
QC1 database (advanced users):
browse |
plot
|
This tutorial provides information for the cross dispersers Health Check trending.
It is based on Cross Disperser [CD] alignment calibration data obtained with dedicated Health Check OBs executed daily.
These OBs obtain four sets of CD-Alignment data, one set for each of the four CDs, each set comprising 2 RAW frames. The 2 RAW frames of each set image the zeroth echelle order, with the CD being moved away and then back into position between the two exposures.
The objective of the data is to measure the accuracy and precision of the positioning of the CDs, in order to confirm that the CDs can be repositioned in the morning after SCIENCE are acquired for acquisition of calibrations.
 Cross Dispersers parameters
QC1_parameters
| FITS key |
QC1 database: table, name |
definition |
class* |
HC_plot** |
more docu |
| QC.YDIFFAVG | uves_zflat..ydiffavg | average y difference of zero orders | CAL |  | [docuSys coming] |
| QC.YDIFFRMS | uves_zflat..ydiffrms | rms of y difference | CAL | | [docuSys coming] |
*Class: KPI - instrument performance; HC - instrument health; CAL - calibration quality; ENG - engineering parameter
**There might be more than one. |
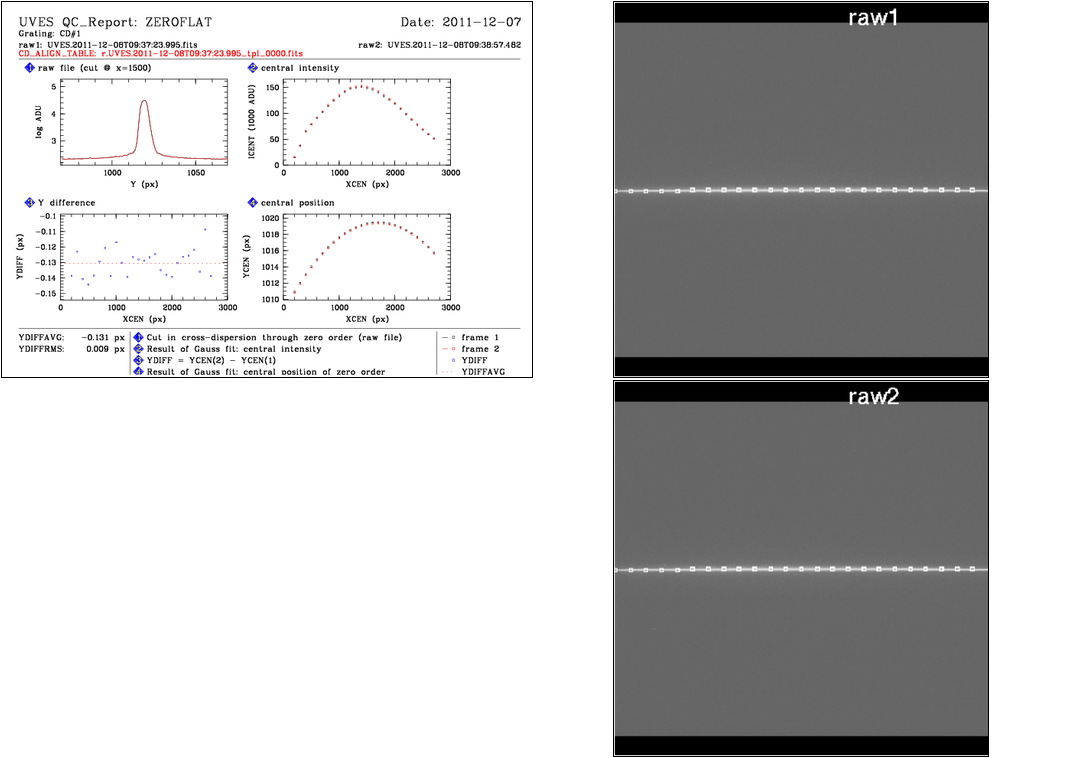 |
Montage of the different QC reports
|
plot 1:cut in cross-dispersion through zeroth order of the two RAW files (black - first frame, red second frame)
plot 2:central intensity from results of gaussian fits to the cross-dispersion profiles at each point sampled along the zeroth order (black - first frame, red second frame)
plot 3:differences between the centers of the gaussian fits to the cross-dispersion profiles of the two frames at each point sampled along the zeroth order (black - first frame, red second frame)
plot 4:the centers of the gaussian fits to the cross-dispersion profiles of the two frames at each point sampled along the zeroth order (black - first frame, red second frame)
The zero order flats are used to test the alignment and stability of the positions of the four UVES crossdispersers (CD). They are measured daily whenever UVES is operational and are a supplement to the format check frames.
The zero order flats are measured within a sequence. There are two exposures for each CD: the CD is moved from two opposite sides to the nominal position. Differences in Y (cross dispersion) position of the zero orders indicate problems in the positioning of the CD.
Trending
The test of the alignment is performed to confirm that the Cross Dispersers are in the same position for the Night Science and the day Calibrations.
We do not trend these checks on long time scale
Scoring&thresholds Cross Dispersers parameters
Scoring thresholds have been set rather losely .
History
The history is displayed only on a 90 days time scale
Algorithm Cross Dispersers parameters
ydiffavg: Average order position shift (average y difference of zero orders).
ydiffrms: RMS order position shift.
|
