instrumental features and problems
| HOME | INDEX | SEARCH | HELP | NEWS |
| VIMOS
Quality Control: instrumental features and problems |
|||||
|
|
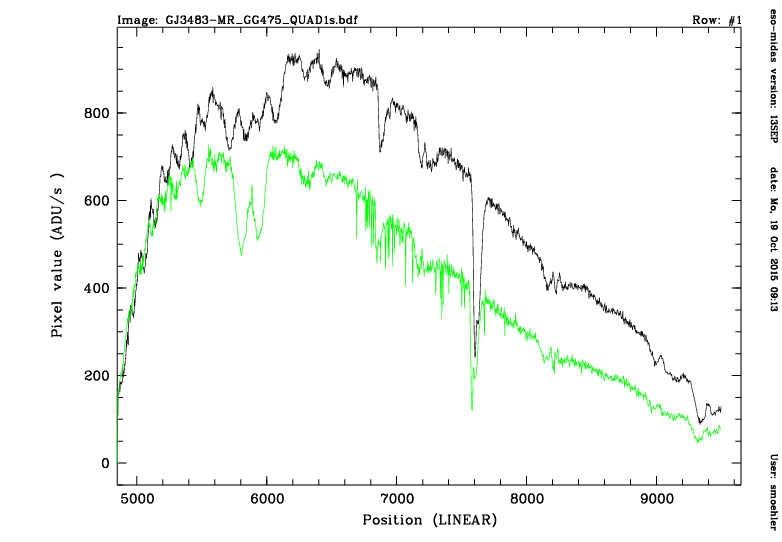
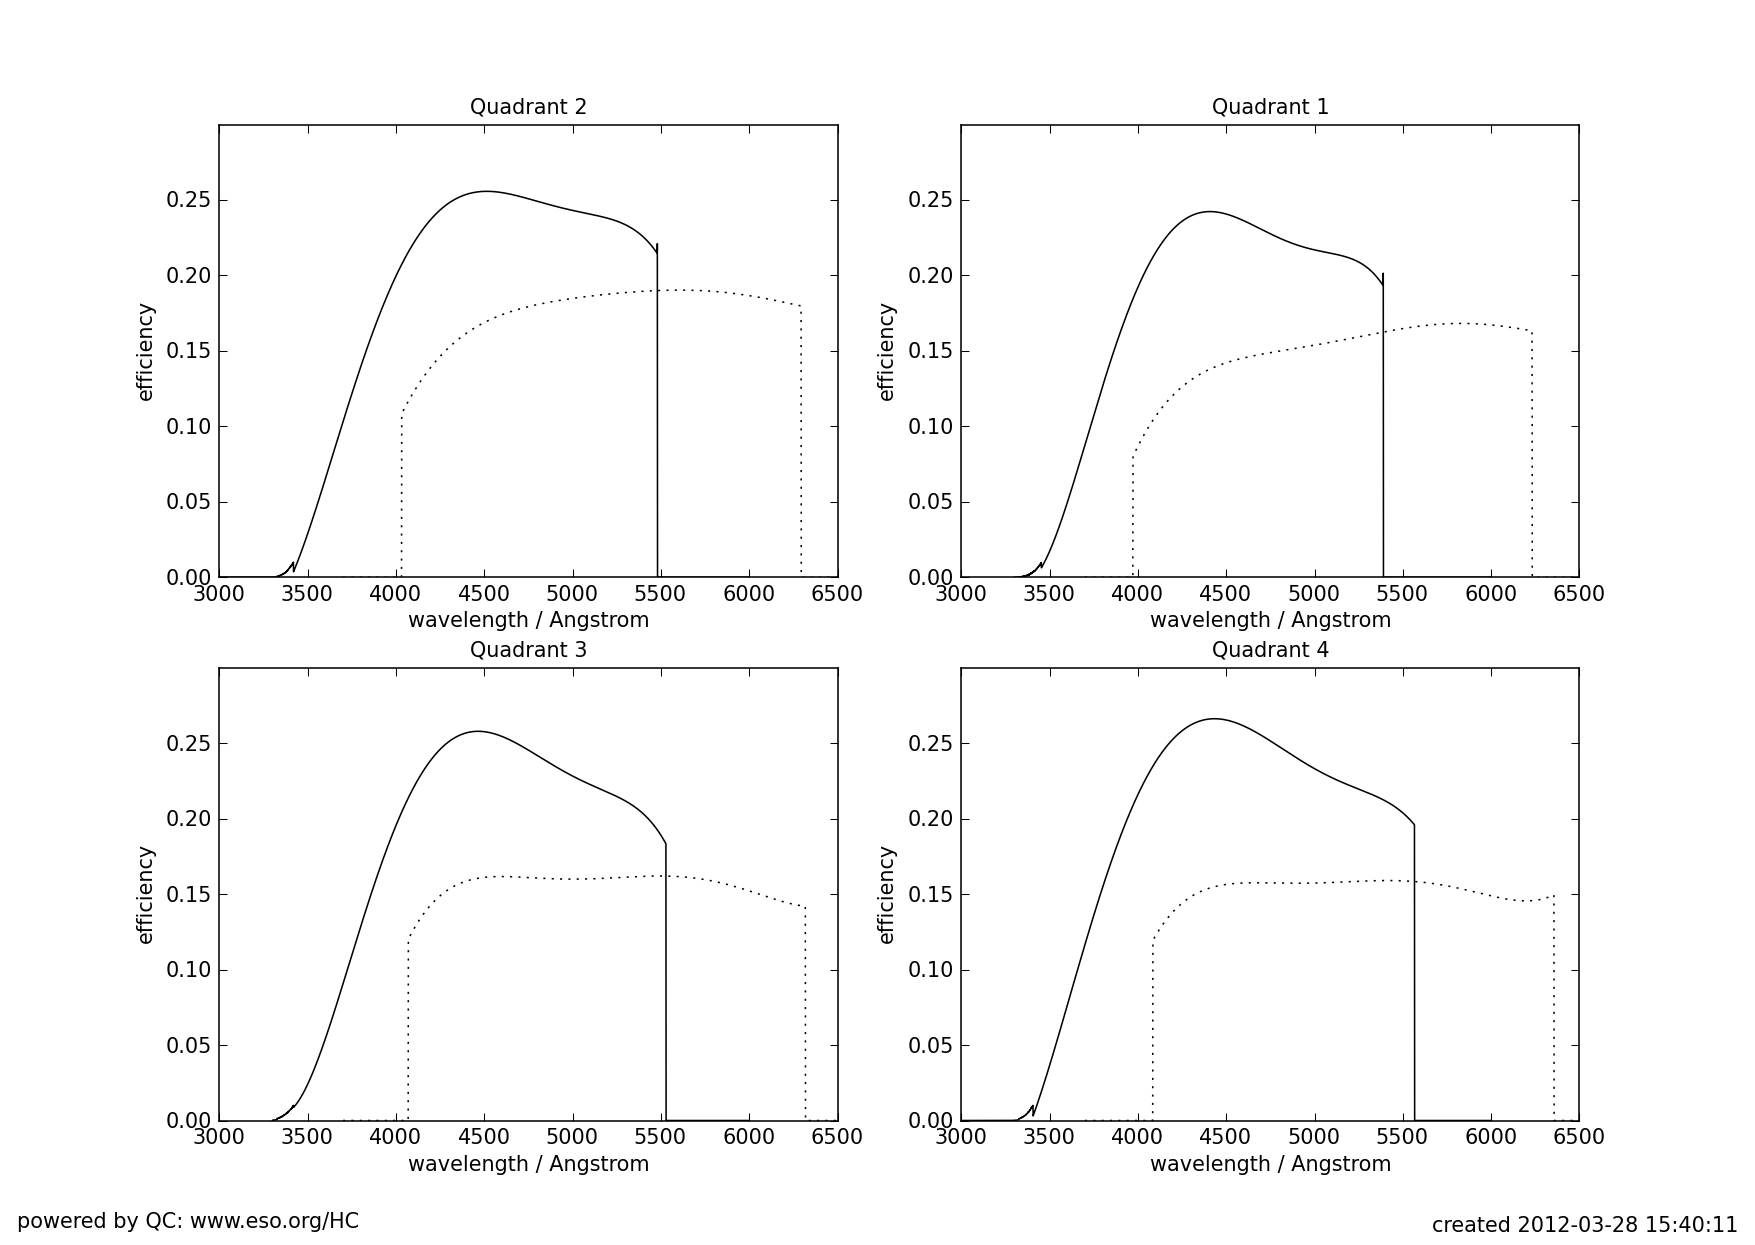
Absorption feature in GG475 filter The GG475 filters in quadrants 3 and 1 introduce an absorption feature between about 5800 and 6000A. The filters have about 10 to 20% of their weight in sodium oxide. Impure manufacturing is likely the cause of this feature. Example observations showing the absorption in a featureless white dwarf for quadrants 3 (strong) and 1 (less strong) can be found here. New HR_blue grisms A new set of HR_blue grisms has been installed in March 2012. The peak efficiency is increased (from about 15% to 25% in MOS, see here for a comparison) while the spectral resolving power is slightly decreased (from R = 1900 to R = 1400 at 5000A for 1 arcsec slits). See also the instrument news page. Instrument upgrade 2010 Several parts of VIMOS have been upgraded between May and July 2010. In particular, new detectors have been installed which give increased sensitivity in the red and have dramatically reduced fringing. An active flexure compensation system has also been installed which will be used to minimize flexures within the instrument due to rotation. Please see the instrument news page for further details. MOS arc lamp exposures
MOS spectrophotometric standards. Standard star observations can be subject to slitt losses, especially in quadrant 4. See also the note on specphot variability. IFU: lost Fibres. The theoretical number of 400 fiber spectra per pseudo slit is not reached. Two fibers in the middle of each block of 80 fibers are typically missing because they are vignetted by the IFU head shutter. There is also vignetting present at one border of each CCD. The actual number of lost fibers cannot be predicted since the positions of the fibers on the raw images vary within 2 to 5 pixels. Depending on the quadrant, 20 to 40 fibers are typically lost on each pseudo slit. IFU fringing. Internal reflections within the IFU unit produces interference; the origin is not completely understood. Fringing is almost zero at 400 nm and increases to about 7% of the flux level towards longer wavelengths. The pattern cannot be completely repoduced. Details can be found in the paper of Jullo et al., 2008, in: The 2007 ESO Calibration Workshop, eds. Kaufer/Kerber, p. 343. IFU: elongation of point sources. The VIMOS IFU head is positioned at the edge of the total field of view (see e.g. VIMOS IMG FOV). Point-like sources are, therefore, imaged slightly elongated (basically in y direction). IFU: contamination in Low-Resolution grisms. In LR observations all 4 pseudo-slits are used. This implies second order contaminations between different pseudo-slits. The pipeline may not distinguish between real object spectra and spectra produced by second order contamination. When a pseudo-slit is strongly contaminated by second order spectra, the reconstructed image by the pipeline may contain dummy objects. An example of contamination in quadrant 2 in the raw frame and in the reconstructed image is shown here. The raw frame (on the left) contains the spectra of a bright object in pseudo-slit 2 and the second order contaminations are in pseudo-slits 3 and 4. In the reconstructed image (on the right), in addition to the real bright object (bottom right), there are also the dummy objects resulting from the second order contamination in pseudo-slit 3 (top right) and in pseudo-slit 4 (bottom left).
Focus problems in quadrant 3 Quadrant 3 suffers from focus problems in IFU mode which depend on the rotator angle. As a result of this, the reachable spectral resolution can be worse by 20% for LR grisms and 30% for HR grisms around RA = 120 degress. Other quadrants are not affected.
2011, March: exchange of video board of FIERA A (change of gain) On 1 March 2011, the video board of FIERA A was exchanged. This implied a change of the gain for quadrants 2 and 3. Affected are all observations after 1 March 2011. Please note that not all delivered raw fits files (and their derived pipeline products) have corrected CONAD values (which are written to the header keyword DET.OUT1.CONAD). New CONAD values (in e/ADU) have been measured for all quadrants and are listed below:
The gain values have been adjusted again around 15 April 2011. All files recorded after 25 April 2011 have correct CONAD values in their headers. These values are:
2010, August until 2011, May: reduced spectral resolution in quadrant 4 MOS and IFU observations using quadrant 4 showed a reduced spectral resolution on the upper part of the detector after the instrument upgrade. For observations with the LR_red grism, a resolving power R of about 220 (instead of 240) at 8000A can be expected. With the HR_blue grism, the resolving power may be only 1300 instead of 2200 at 5875A (for a 1 arcsec slit). The problem was solved by fixing the tilt of the focal plane during the intervention in May 2011. 2008 to 2010: pick-up noise in IFU data Since April 2008, several observations have been affected by pick-up noise. It is mainly visible in quadrant 1 of IFU observations using the HR_blue grism. It is present with a periodic pattern in dispersion direction of the raw frames with an amplitude of about 10 ADUs. Its intensity is varying so that it usually cannot be corrected with bias frames. Its presence can decrease the attainable S/N for faint targets. After the instrument upgrade in July 2010, pick-up noise has so far not been observed.
|
||||||||||||||||||||||||||||||||||||||||||||||||||||||||||||||||||||||||||||||||||||||||||||||||||||||||||||||||||||||||||||||||||||||||||||||||||||||||||||||||||||||||||||||||||||||||||||||||||||||||||||||||
|
|
|||||||||||||||||||||||||||||||||||||||||||||||||||||||||||||||||||||||||||||||||||||||||||||||||||||||||||||||||||||||||||||||||||||||||||||||||||||||||||||||||||||||||||||||||||||||||||||||||||||||||||||||||
 |
|
||||||||||||||||||||||||||||||||||||||||||||||||||||||||||||||||||||||||||||||||||||||||||||||||||||||||||||||||||||||||||||||||||||||||||||||||||||||||||||||||||||||||||||||||||||||||||||||||||||||||||||||||
![[contamination.gif]](http://www.eso.org/observing/dfo/quality/VIMOS/img/contamination.gif)
![[contamination.gif]](http://www.eso.org/observing/dfo/quality/VIMOS/img/IFUcontamLRredraw.gif)
![[contamination.gif]](http://www.eso.org/observing/dfo/quality/VIMOS/img/IFUcontamLRredFOV.gif)
![[ifu_resol_HRb_Q3.gif]](http://www.eso.org/observing/dfo/quality/VIMOS/img/ifu_resol_HRb_Q3.gif)
![[pickup_raw.gif]](http://www.eso.org/observing/dfo/quality/VIMOS/img/pickup_raw.png)
![[pickup_reduced.gif]](http://www.eso.org/observing/dfo/quality/VIMOS/img/pickup_reduced.png)