Number-density evolution of Lyman-alpha line

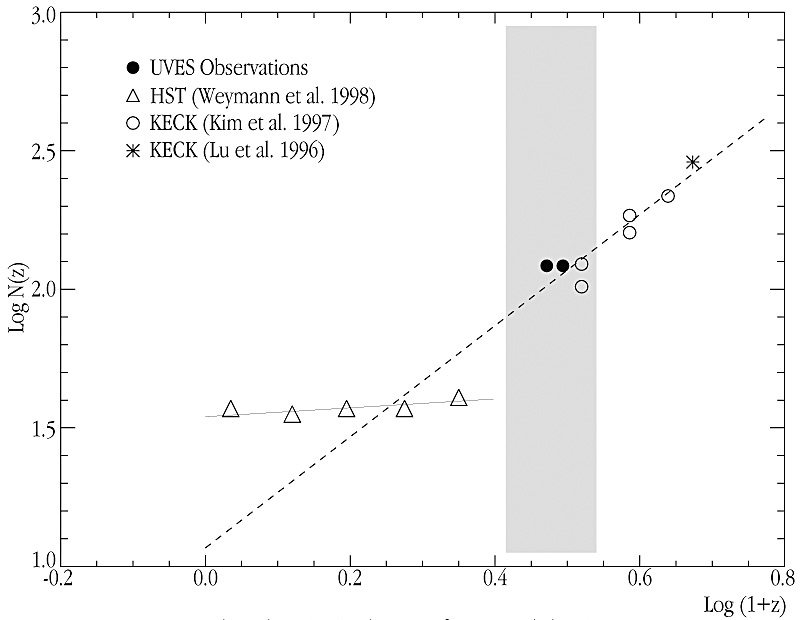
This image shows the number-density evolution of the Lyman alpha lines, observed with UVES in the quasars HE22-28 and QSO J2233-606 .
The latter is the QSO at the centre of the southern Hubble Deep Field (HDF-South), with z(em) = 2.238 The two filled symbols at the centre of the diagram represent the number density of hydrogen lines at N(HI) = 10 (13.64-16) cm -2. The measurements from HE22-28 (to the right; average z = 2.12) and J2233-606 (left; average z = 1.96) fall in the middle of the little studied redshift interval, l1.6 dN/dz = 11.75 (1+z) 2.01. The new determinations based on the UVES observations seem to be in reasonable agreement with the Keck measurements at higher redshifts, indicating a similar number density evolution. Contrarily, there is a discrepancy with the measurements at redshift z.
Kilde:ESO
Om billedet
| Id: | eso0013g |
| Type: | Diagram |
| Udgivelsesdato: | 6. april 2000 |
| Relaterede pressemeddelelser: | eso0013 |
| Størrelse: | 800 x 620 px |
Om objektet
| Navn: | QSO HE22-28, QSO J2233-606 |
| Type: | Early Universe : Galaxy : Activity : AGN : Quasar |
| Kategori: | Cosmology Quasars and Black Holes |