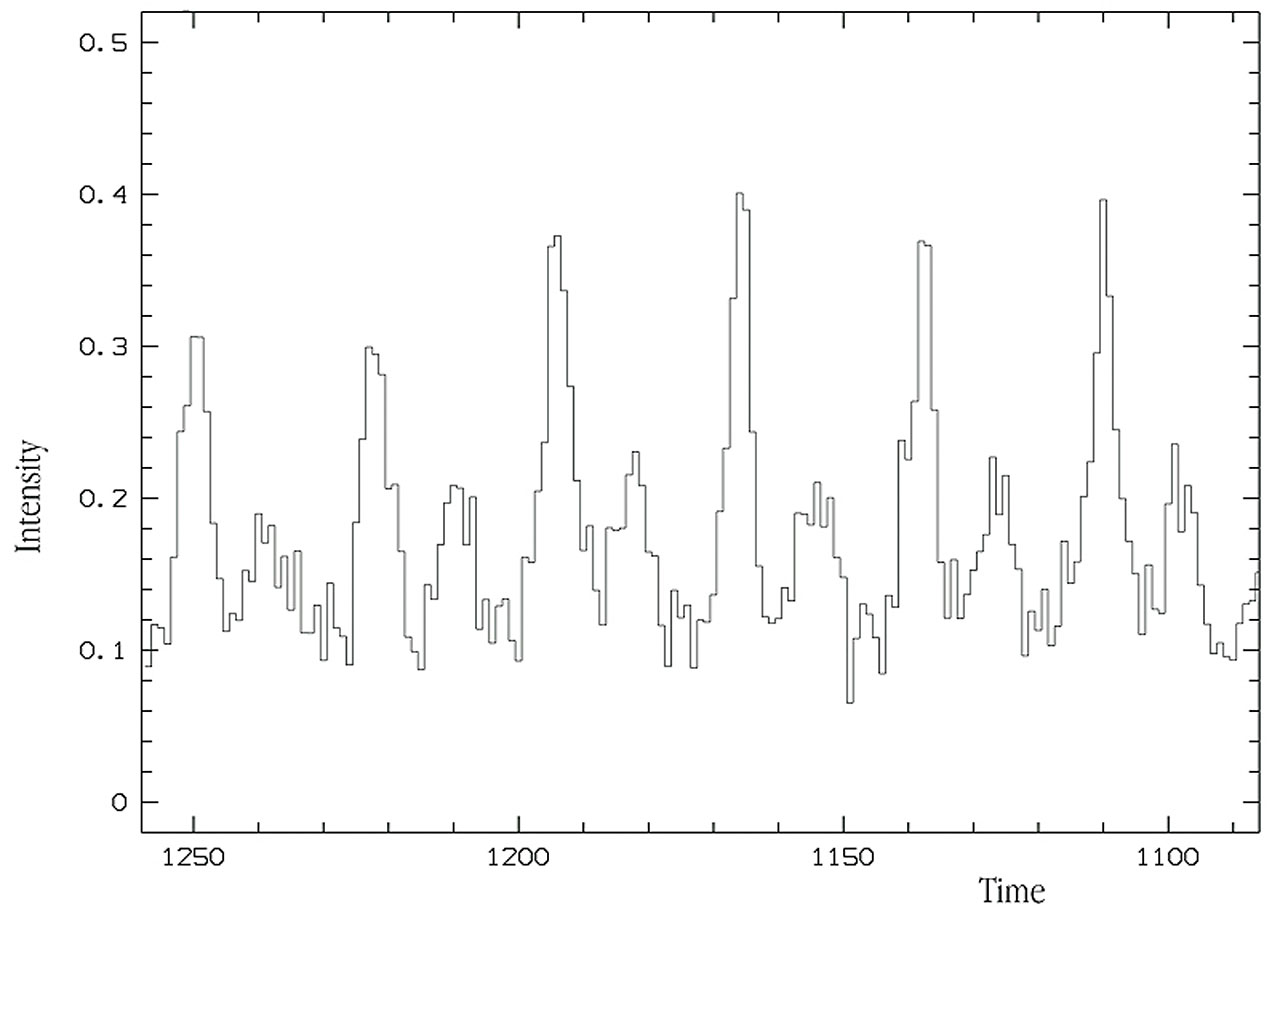
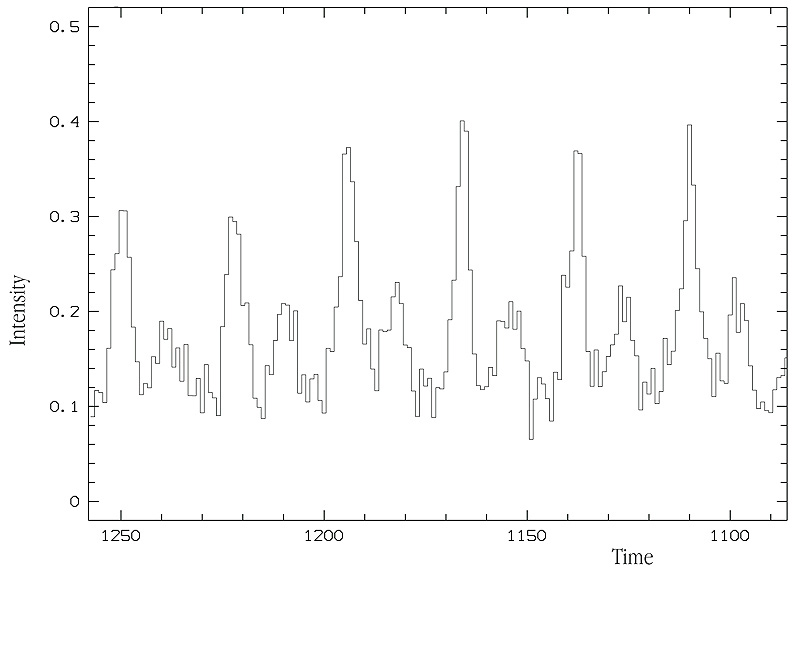
Light curve of Crab Pulsar

In this diagram, the time increases along the abscissa axis (1 pixel = 1.2 msec) and the momentary intensity (uncalibrated) is along the ordinate axis. One full revolution of the neutron star corresponds to the distance from one high peak to the next, and the diagram therefore covers six consecutive revolutions (about 200 milliseconds). Following thorough testing, this new observing mode will allow to investigate the brightness variations of this and many other objects in great detail in order to gain new and fundamental insights in the physical mechanisms that produce the radiation pulses. In addition, it is foreseen to do high time resolution spectroscopy of rapidly varying phenomena. Pushing it to the limits with an 8.2-m telescope like KUEYEN will be a real challenge to the observers that will most certainly lead to great and exciting research projects in various fields of modern astrophysics.
Källa:ESO
Om bilden
| ID: | eso9948i |
| Typ: | Diagram |
| Publiceringsdatum: | 17 november 1999 |
| Relaterade pressmeddelanden: | eso9948 |
| Storlek: | 800 x 647 px |
Om objektet
| Namn: | Crab Pulsar |
| Typ: | Milky Way : Star : Evolutionary Stage : Neutron Star : Pulsar |
| Avstånd: | 6000 ljusår |
| Kategori: | Stars |