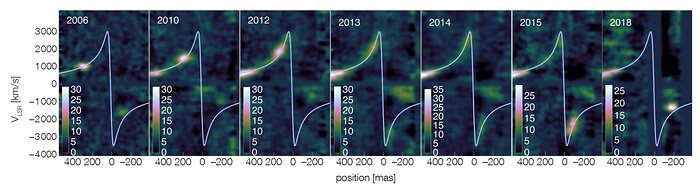
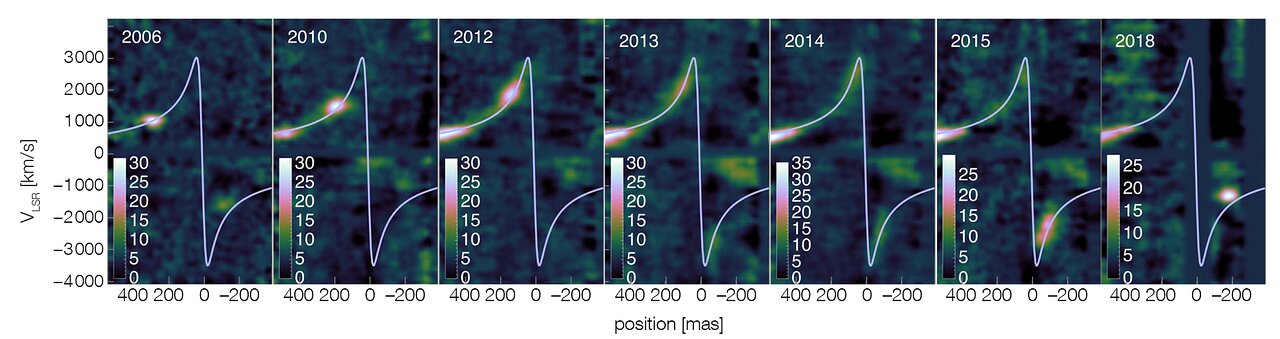
Series of position-velocity diagrams of G2 obtained with SINFONI at the VLT
In these position-velocity diagrams of the G2 star, we can see how the initially compact gas cloud gets stretched ever more as it moves along the orbit (blue line). It starts to swing around the supermassive black hole in 2013, in 2014 (at nominal pericentre passage) roughly equal amounts of gas are on the red- and blue-shifted sides, and in 2015, G2 has completely moved around. In 2018 the cloud appears more compact again, as expected in tidal evolution. Note the deviation from the Keplerian orbit in 2018, showing that the object has slowed down during pericentre passage.
Credit:ESO/Gillessen et al. (2019)
About the Image
| Id: | position-velocity-diagrams |
| Type: | Collage |
| Release date: | 23 September 2020, 12:54 |
| Size: | 1992 x 528 px |
About the Object
| Type: | Unspecified |
| Category: | Illustrations |