The central maximum, in units of total flux of a PSF source, is a measure of
the image quality and the adaptive optics (AO) performance. A least once per
day an illuminated internal fibre is imaged with the adaptive optics active
(K-band grating at the 25 mas pixel scale). The sinfo_rec_jitter recipe
subtracts a DARK and performs a cube reconstruction. The strehl ratio is
calculated on this single internal fibre image as a function of wavelength
(NB. Being an internal source the fibre image is not subject to any
atmospheric turbulence).
strehl ratio of the fibre (i.e. the median value of all wavelengths within the reconstructed cube)
encircled energy of the fibre (i.e. the median value of all wavelengths within the reconstructed cube)
rms error in the strehl ratio (in units of 10-4)
mean flux of the extracted fibre spectrum
The AO fibre health check is only obtained with the K-band grism at the 25 mas pixel scale.
QC report1 for HCAO frames.
QC report2 for HCAO frames.
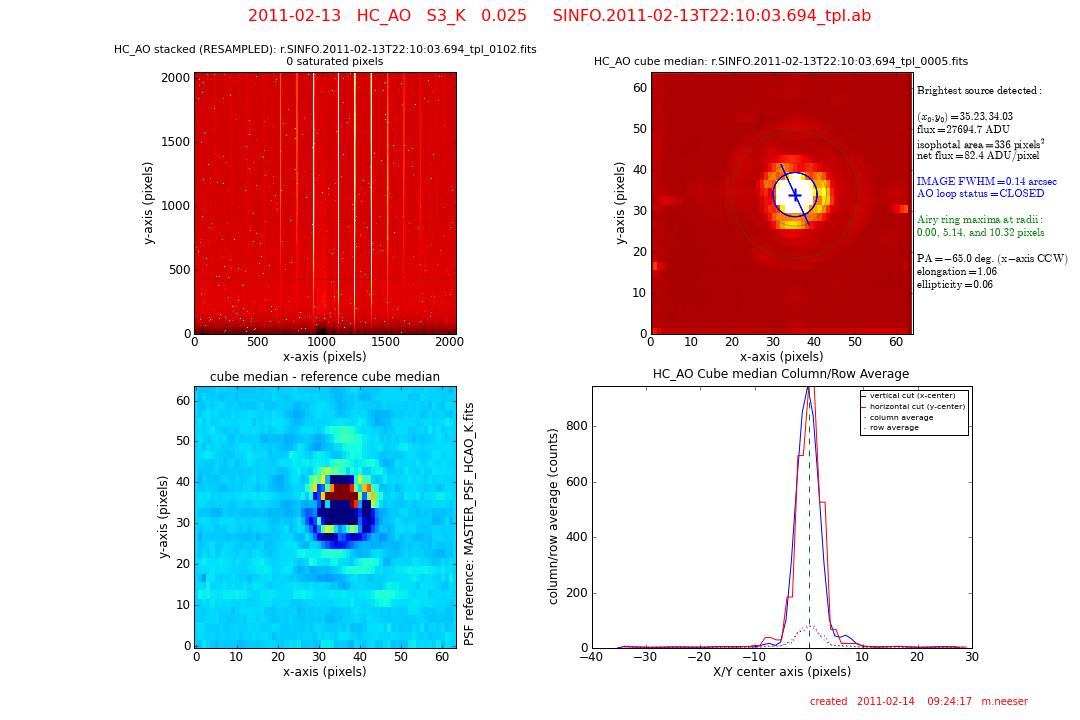
The QC report1 for the HCAO includes:
UL: the PSF_CALIBRATOR_STACKED full detector product image (after wavelength resampling) with the number of saturated pixels listed.
UR: the MASTER_PSF median cube collapsed image. A number of paramters are listed for the brightest source detected:
source center (pixels), the integrated flux (within 3 sigma), the isophotal area (3 sigma), the net flux per pixel, the image FWHM (arcsec), the status of the AO loop (OPEN or CLOSED), the position angle of the brightest source (degrees CCW from the x-axis), and its elongation and ellipticity. The source center, its position angle, and its FWHM are marked on the image. The FWHM of the HCAO fibre image should always be FWHM=0.14 arcsec +/- 0.02 arcsec.
LL: the (scaled) difference between two cube planes. Plane 100 - Plane 2072.
LR: a horizontal (blue line) and vertical (red line) cut through the center of the brightest detected source of the MASTER_PSF median cube collapsed image. The respective averages through this center are shown as dotted lines.
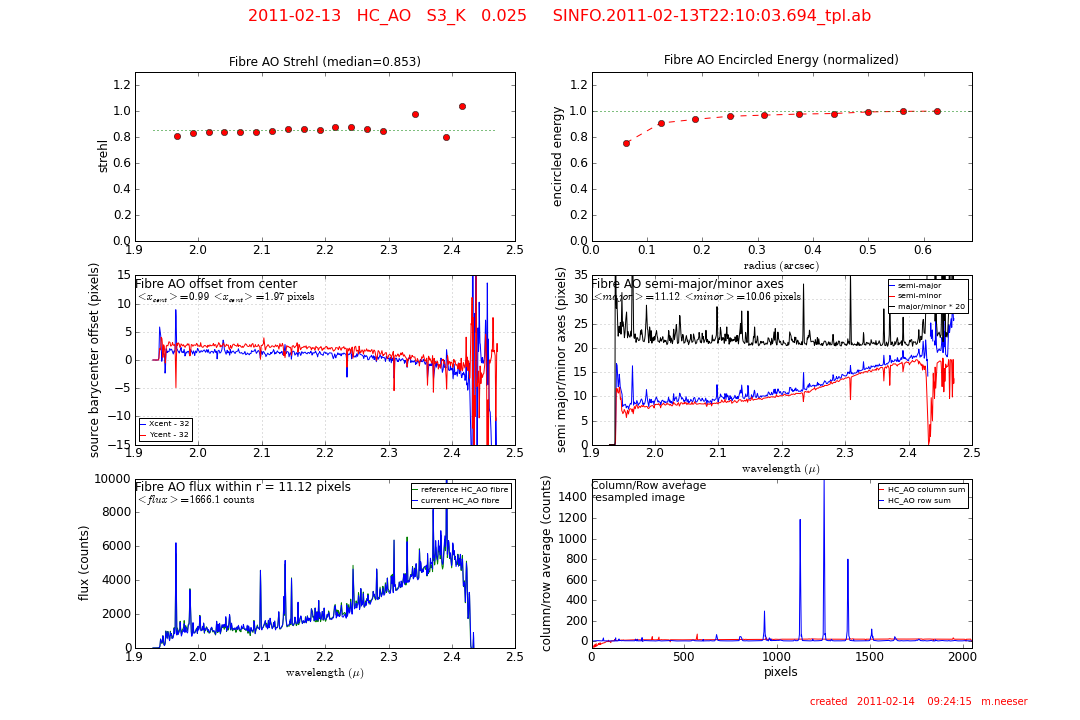
QC Report 2:
UL: the fibre strehl ratio as a function of wavelength. The median strehl is noted in the figure title and is plotted as a dotted green line. (Occasionally, a pipeline error allows for strehl ratios at long wavelengths to be >1).
UR: the normalized encircled energy as a function of radius (arcseconds) from the centroid of the fibre image.
CL: the centroid offset position of the fibre in the X- (blue) and Y-axis (red) as a function of wavelength.
CR: the semi-major axis (blue) and semi-minor axis (red) and the ratio of the two (multiplied by 20) (black) of the fibre image. The ratio of the axes should be roughly constant as a function of wavelength.
LL: the extracted spectrum of the fibre cube averaged over the source FWHM and smoothed. The current spectrum is shown in blue and is over-plotted on that of the reference HC_AO fibre (shown in green). Units are in counts.
LR: the column (red) and row (blue) averages over the PSF_CALIBRATOR_STACKED image plotted in Report 1 (UL).
Based on a single observation of the internal illuminated fibre, the sinfo_rec_jitter recipe subtracts a DARK frame and performs a cube reconstruction. The strehl ratio is determined using:
where Imaxobj is the maximum intensity measured in the sky-subtracted object and Fobj is its corresponding total flux. ImaxPSF and FPSF are, respectively, the theoretical maximum intensity and total flux attainable given the telescope M1 and M2 diameters, the central wavelength and wavelength range, at a given pixel scale. The strehl ratio plotted is the median of all the strehl values computed for each wavelength step in the reconstructed image cube.
The encircled energy is simply the integrated counts within radii of increasing r centered on the position of the fibre's maximum flux.
Plot 3: error strehl ratio
The standard deviation of all the strehl values computed for each wavelength step in the reconstructed image cube.
For each wavelength plane of the reconstructed image cube, the source is detected and the total counts are integrated, resulting in an extracted spectrum of flux vs. wavelength. The mean value of this extracted spectrum is computed and is used to monitor the health and stability of the fibre lamp.
~
~
~
~
 Parameters trended